bridgette, a wildlife filmmaker, is working on a documentary about cheetahs. this morning, she starts…
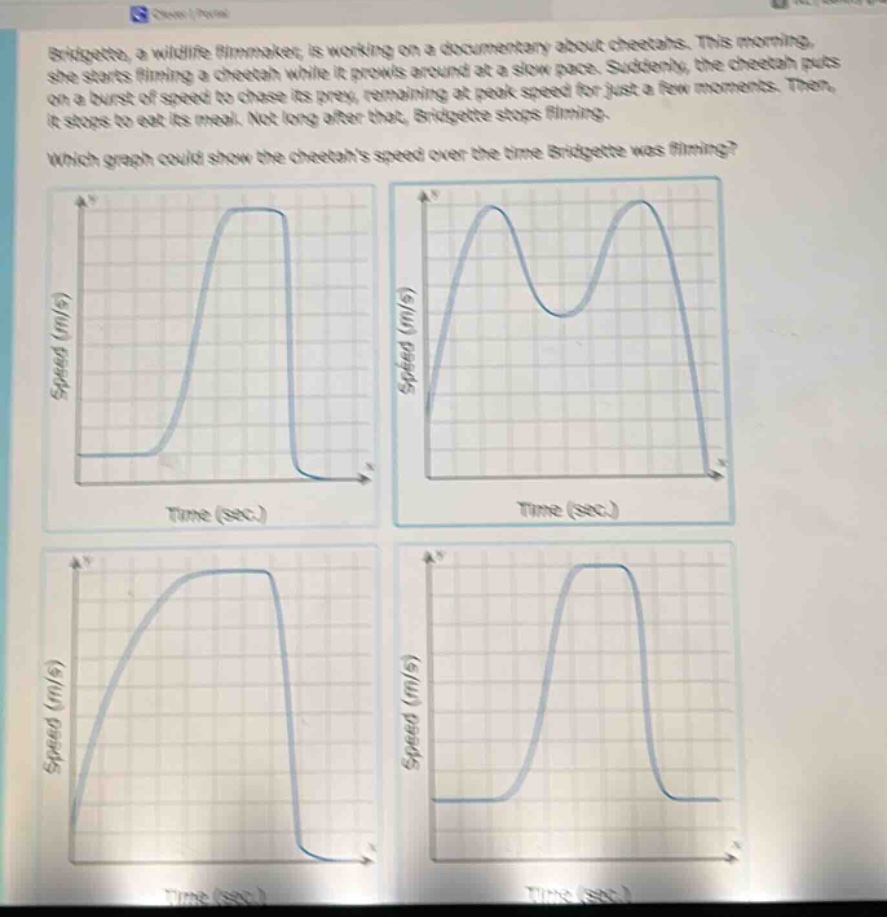
bridgette, a wildlife filmmaker, is working on a documentary about cheetahs. this morning, she starts filming a cheetah while it prowls around at a slow pace. suddenly, the cheetah puts on a burst of speed to chase its prey, remaining at peak speed for just a few moments. then, it stops to eat its meal. not long after that, bridgette stops filming. which graph could show the cheetahs speed over the time bridgette was filming?
Answer
Answer:
The first graph (top - left)
Explanation:
Step1: Analyze initial state
The cheetah starts at a slow pace, so speed is low initially.
Step2: Analyze acceleration
It then has a burst of speed, so speed increases rapidly.
Step3: Analyze peak - speed state
It remains at peak speed for a few moments, so speed is constant.
Step4: Analyze stopping state
Then it stops to eat, so speed drops to zero. The first graph shows these characteristics.