what change would most improve the usefulness of the graph?\nreplace the concentration descriptions with…
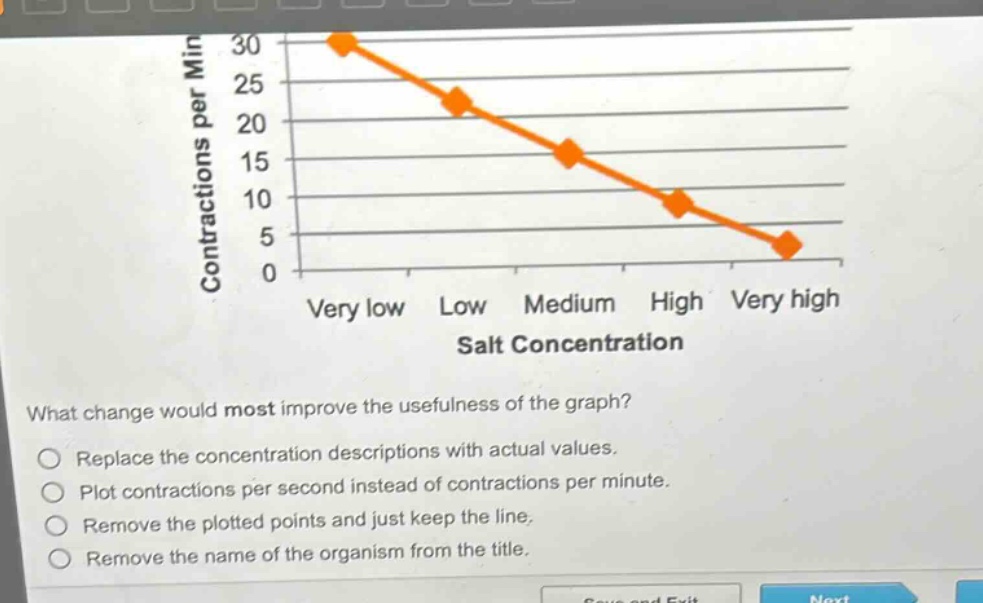
what change would most improve the usefulness of the graph?\nreplace the concentration descriptions with actual values.\nplot contractions per second instead of contractions per minute.\nremove the plotted points and just keep the line.\nremove the name of the organism from the title.
Answer
Brief Explanations:
The graph uses descriptive terms like "very low", "low" etc. for salt - concentration instead of actual numerical values. Using actual values would make it more precise and useful for analysis. Plotting contractions per second instead of per minute doesn't necessarily improve the graph's overall utility. Removing plotted points would make it less accurate and removing the organism's name from the title is irrelevant to improving the graph's utility.
Answer:
Replace the concentration descriptions with actual values.