the chart shows information about four ecosystems. based on the information in the chart, which ecosystem…
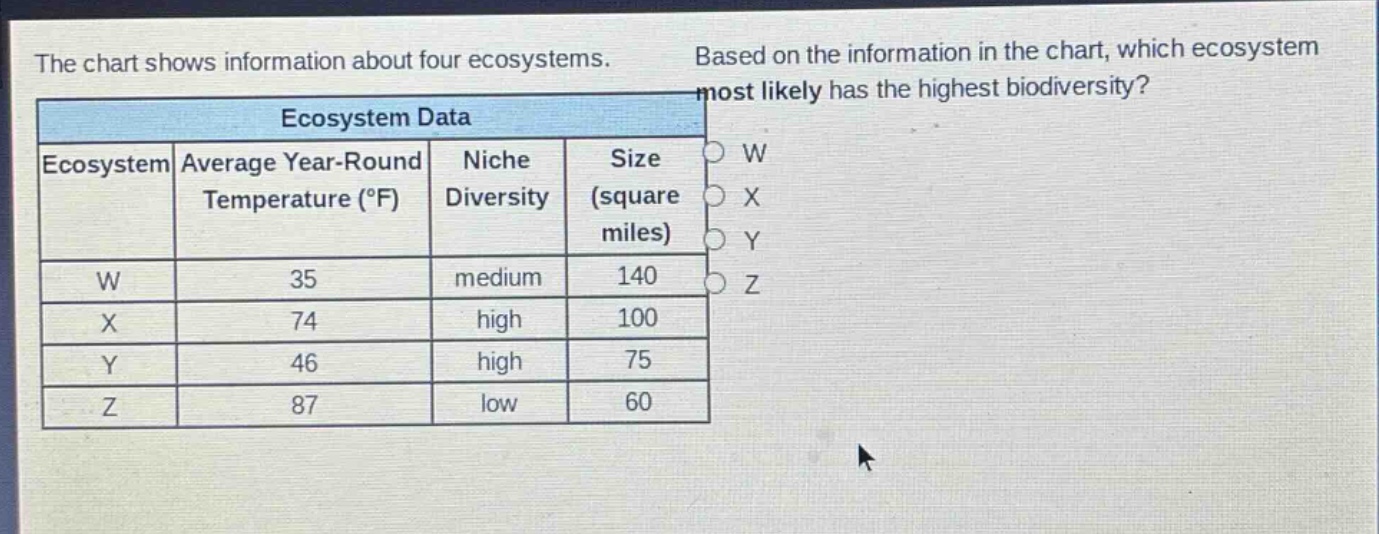
the chart shows information about four ecosystems. based on the information in the chart, which ecosystem most likely has the highest biodiversity?\n| ecosystem | average year - round temperature (°f) | niche diversity | size (square miles) |\n| ---- | ---- | ---- | ---- |\n| w | 35 | medium | 140 |\n| x | 74 | high | 100 |\n| y | 46 | high | 75 |\n| z | 87 | low | 60 |
Answer
Answer:
X
Explanation:
Step1: Identify key - factor for biodiversity
Niche diversity is crucial.
Step2: Compare niche diversities
X and Y have high niche diversity.
Step3: Consider ecosystem size
X is larger than Y (100 square miles vs 75 square miles). So X most likely has highest biodiversity.