which conclusion is supported by the graph?\no more than half of the population has the central skin…
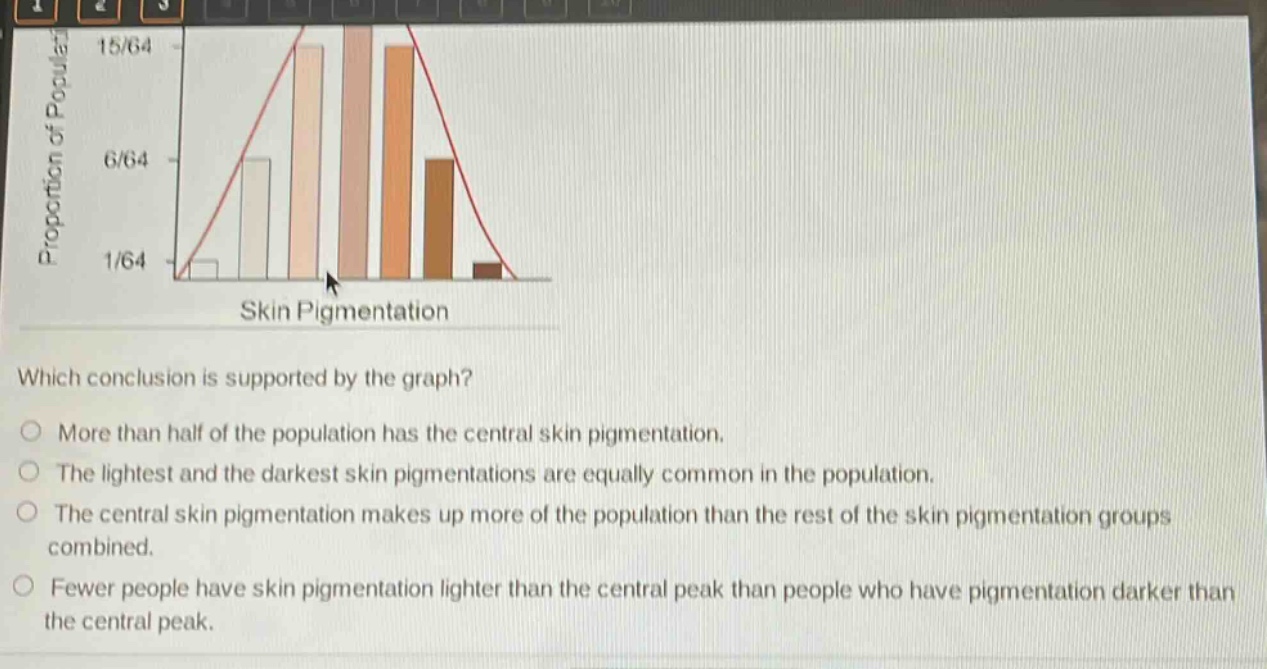
which conclusion is supported by the graph?\no more than half of the population has the central skin pigmentation.\no the lightest and the darkest skin pigmentations are equally common in the population.\no the central skin pigmentation makes up more of the population than the rest of the skin pigmentation groups combined.\no fewer people have skin pigmentation lighter than the central peak than people who have pigmentation darker than the central peak.
Answer
Explanation:
Step1: Analyze the graph
The graph shows the proportion of population for different skin - pigmentation levels. The y - axis represents the proportion of population and the x - axis represents skin pigmentation.
Step2: Evaluate each option
- Option 1: The sum of the proportions of the central skin - pigmentation bars is not more than half of the total (since the total of all bars' proportions is 1 and the central bars' proportions do not exceed 0.5).
- Option 2: The proportion of the lightest and the darkest skin pigmentations is the same (both are 1/64 of the population).
- Option 3: The central skin - pigmentation does not make up more of the population than the rest combined.
- Option 4: By observing the graph, the number of people with skin pigmentation lighter than the central peak is not fewer than those with darker pigmentation.
Answer:
The lightest and the darkest skin pigmentations are equally common in the population.