the estimated number of organisms in a population after t days is shown in the table below.\n| t days |…
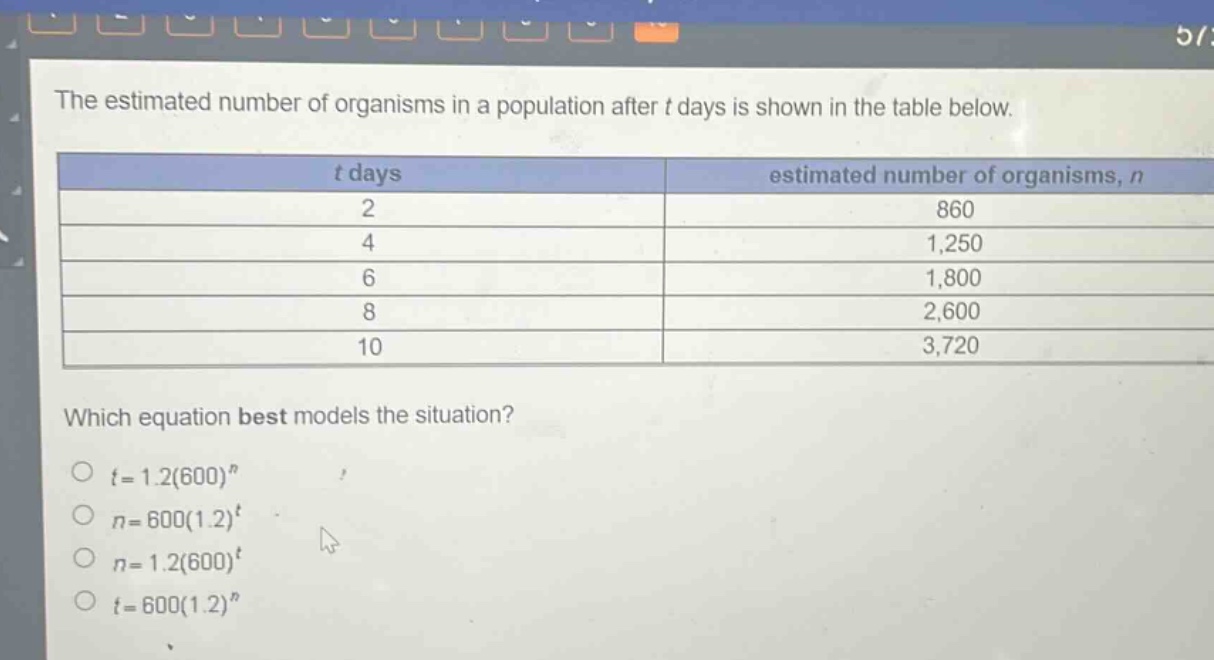
the estimated number of organisms in a population after t days is shown in the table below.\n| t days | estimated number of organisms, n |\n| ---- | ---- |\n| 2 | 860 |\n| 4 | 1,250 |\n| 6 | 1,800 |\n| 8 | 2,600 |\n| 10 | 3,720 |\nwhich equation best models the situation?\n○ t = 1.2(600)^n\n○ n = 600(1.2)^t\n○ n = 1.2(600)^t\n○ t = 600(1.2)^n
Answer
Answer:
B. $n = 600(1.2)^{t}$
Explanation:
Step1: Recall exponential - growth formula
The general form of an exponential - growth model is $n = a(b)^{t}$, where $n$ is the quantity after time $t$, $a$ is the initial amount, $b$ is the growth factor, and $t$ is the time.
Step2: Test the first data - point $(t = 2,n = 860)$ for each option
For option A: $t = 1.2(600)^{n}$, when $t = 2$ and $n = 860$, $2=1.2(600)^{860}$ is not true. For option B: $n = 600(1.2)^{t}$, when $t = 2$, $n=600\times(1.2)^{2}=600\times1.44 = 864$, which is close to 860. For option C: $n = 1.2(600)^{t}$, when $t = 2$, $n=1.2\times(600)^{2}=1.2\times360000 = 432000$, which is not close to 860. For option D: $t = 600(1.2)^{n}$, when $t = 2$ and $n = 860$, $2 = 600(1.2)^{860}$ is not true.
Step3: Check other data - points for option B
For $t = 4$, $n=600\times(1.2)^{4}=600\times2.0736 = 1244.16\approx1250$. For $t = 6$, $n=600\times(1.2)^{6}=600\times2.985984 = 1791.5904\approx1800$. For $t = 8$, $n=600\times(1.2)^{8}=600\times4.29981696 = 2579.890176\approx2600$. For $t = 10$, $n=600\times(1.2)^{10}=600\times6.1917364224 = 3715.04185344\approx3720$. So the equation $n = 600(1.2)^{t}$ best models the situation.