what could explain the curve in this population growth graph? an unlimited food supply a natural disaster a…
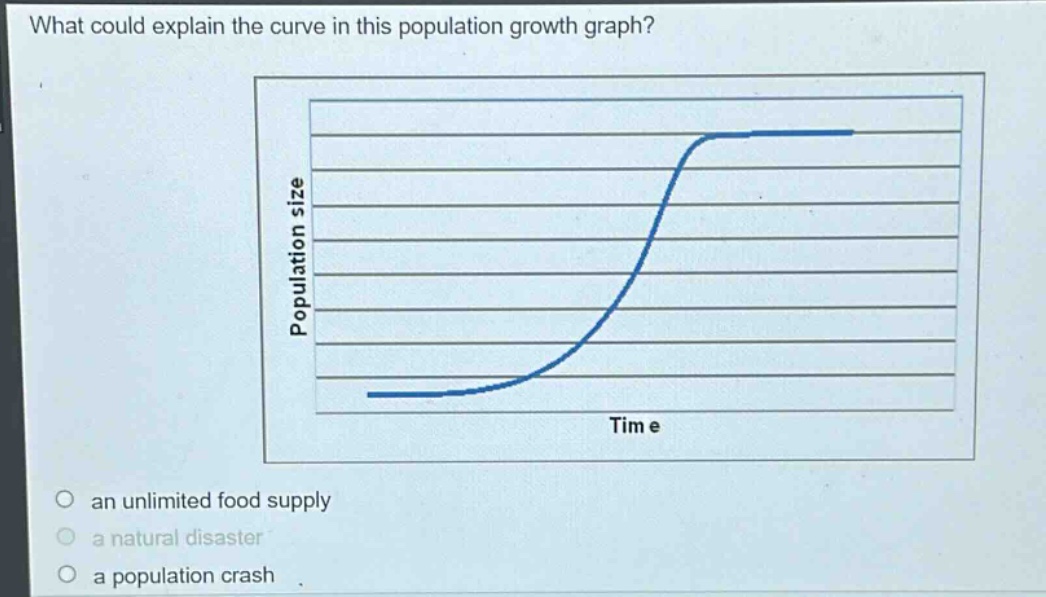
what could explain the curve in this population growth graph? an unlimited food supply a natural disaster a population crash
Answer
Brief Explanations:
The graph shows logistic - growth curve. An unlimited food supply would lead to exponential growth. A natural disaster or population crash would cause a decline in population. The curve levels off as it reaches the carrying capacity, which is not indicated by the other options.
Answer:
None of the above options correctly explain the curve. The curve is a logistic - growth curve which levels off at the carrying capacity of the environment due to limited resources and other factors.