food poisoning occurs when bacteria like salmonella and listeria grow on food. these microorganisms grow at…
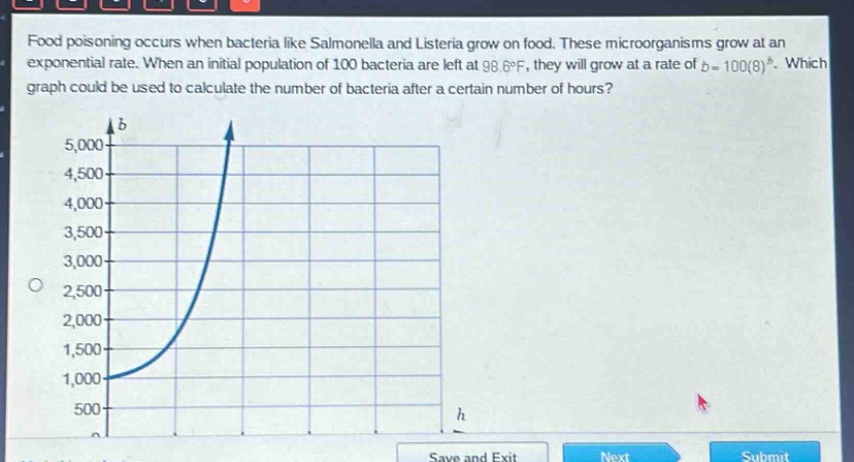
food poisoning occurs when bacteria like salmonella and listeria grow on food. these microorganisms grow at an exponential rate. when an initial population of 100 bacteria are left at 98.6°f, they will grow at a rate of (b = 100(8)^{h}). which graph could be used to calculate the number of bacteria after a certain number of hours?
Answer
Explanation:
Step1: Analyze the exponential - growth formula
The formula for the number of bacteria is $b = 100(8)^{h}$, where $b$ is the number of bacteria and $h$ is the number of hours. When $h = 0$, $b=100(8)^{0}=100$. As $h$ increases, the value of $b$ will increase exponentially.
Step2: Check the initial - value and growth trend of the graph
The graph should start at the point $(0, 100)$ (since when $h = 0$, $b = 100$) and show an exponential upward - trend. The given graph starts above $100$ on the $b$ - axis when $h = 0$ and has an exponential growth shape. But we need to consider the correct initial value. Let's find the value of $b$ for some small non - zero values of $h$. When $h = 1$, $b=100\times8 = 800$; when $h = 2$, $b=100\times8^{2}=100\times64 = 6400$. The graph should show a rapid increase as $h$ increases.
Answer:
The graph that starts at the point $(0,100)$ and has an exponential upward - trend (not the one shown in the image as it starts above 100 when $h = 0$) is the correct graph for the function $b = 100(8)^{h}$. Since no other options are given, we can only describe the characteristics of the correct graph. The correct graph has an initial value of 100 (when $h = 0$) and shows exponential growth as $h$ increases.