which form of natural selection does the graph represent?\nproportion of individuals\ntrait value\norange =…
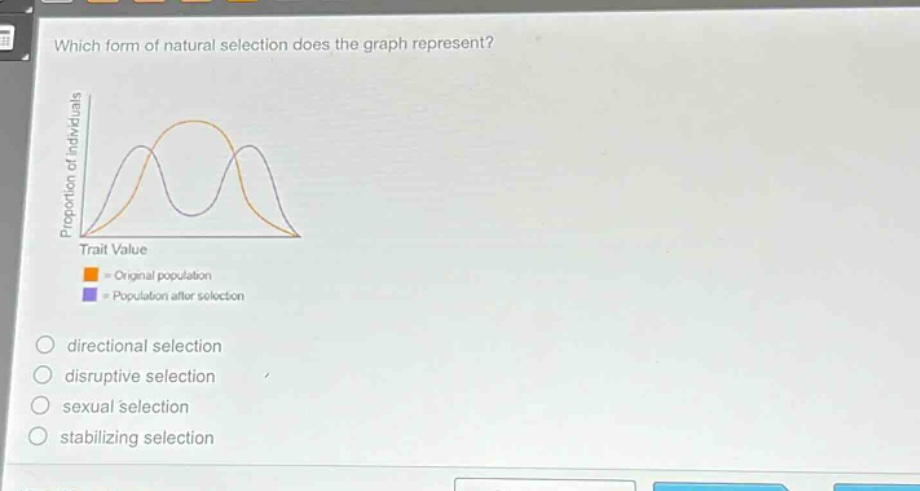
which form of natural selection does the graph represent?\nproportion of individuals\ntrait value\norange = original population\npurple = population after selection\ndirectional selection\ndisruptive selection\nsexual selection\nstabilizing selection
Answer
Brief Explanations:
In disruptive selection, extreme phenotypes are favored over intermediate ones. The graph shows the original population with a single - peak distribution and the population after selection splitting into two peaks at the extremes of the trait value, indicating disruptive selection.
Answer:
disruptive selection