which form of natural selection does the graph represent?\nproportion of individuals\ntrait value\noriginal…
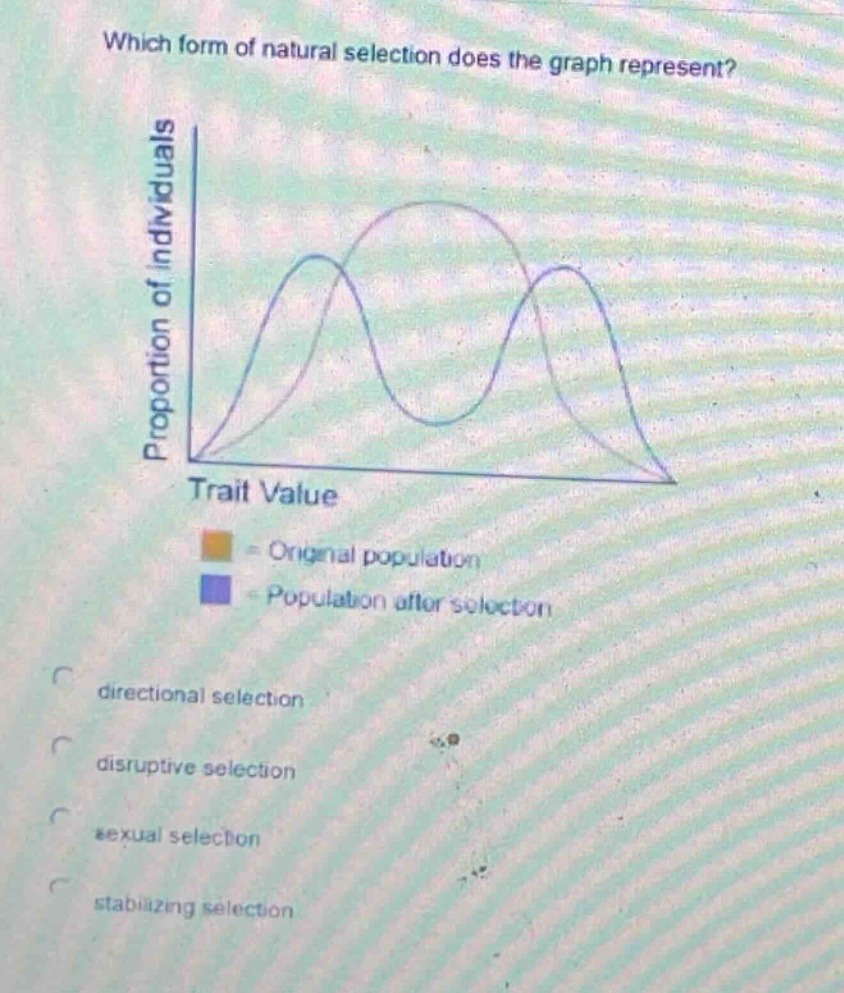
which form of natural selection does the graph represent?\nproportion of individuals\ntrait value\noriginal population\npopulation after selection\ndirectional selection\ndisruptive selection\nsexual selection\nstabilizing selection
Answer
Brief Explanations:
In disruptive selection, extreme - valued phenotypes are favored over intermediate ones. The graph shows that the original population with an intermediate - peak distribution has split into two sub - populations with extreme trait values after selection, which is characteristic of disruptive selection. Directional selection shifts the population towards one extreme, sexual selection is related to mating success, and stabilizing selection favors the intermediate phenotype.
Answer:
B. disruptive selection