a function models the growth of a sample starting with 40 bacteria with the ability to double every two…
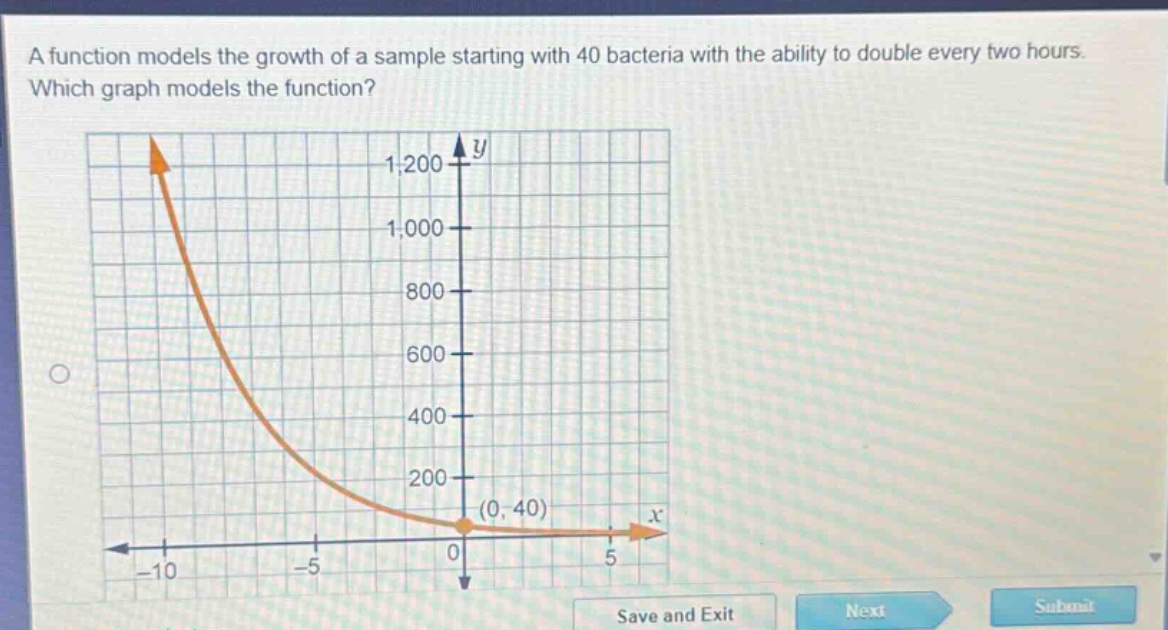
a function models the growth of a sample starting with 40 bacteria with the ability to double every two hours. which graph models the function?
Answer
Explanation:
Step1: Identify the exponential - growth formula
The general form of an exponential - growth function is $y = a\cdot b^{\frac{x}{k}}$, where $a$ is the initial amount, $b$ is the growth factor, $x$ is the independent variable (time in this case), and $k$ is the time it takes for the quantity to change by the factor $b$. Here, $a = 40$ (initial number of bacteria), $b = 2$ (doubling growth factor), and $k = 2$ (doubling time is 2 hours). So the function is $y=40\cdot2^{\frac{x}{2}}$.
Step2: Analyze the properties of the function
When $x = 0$, $y=40\cdot2^{0}=40$. As $x$ increases, the value of $y$ will increase exponentially. The function is an exponential - growth function, and its graph should start at the point $(0,40)$ and increase as $x$ increases. The given graph in the question is a decay - type graph (it decreases as $x$ increases), which is incorrect. A correct graph of the function $y = 40\cdot2^{\frac{x}{2}}$ should be an increasing curve starting at the point $(0,40)$. Since no other graphs are provided, we know that the graph shown is not the correct one for the given exponential - growth function. But if we were to describe the correct graph: It is an exponential growth curve with $y$ - intercept at $(0,40)$ and it rises as $x$ increases.
Since no correct graph options are provided, we can't give a specific answer from the given choices. But the correct graph should be an increasing exponential curve starting at the point $(0,40)$.