the game commission introduces 200 white - tailed deer into a newly acquired national game and wildlife…
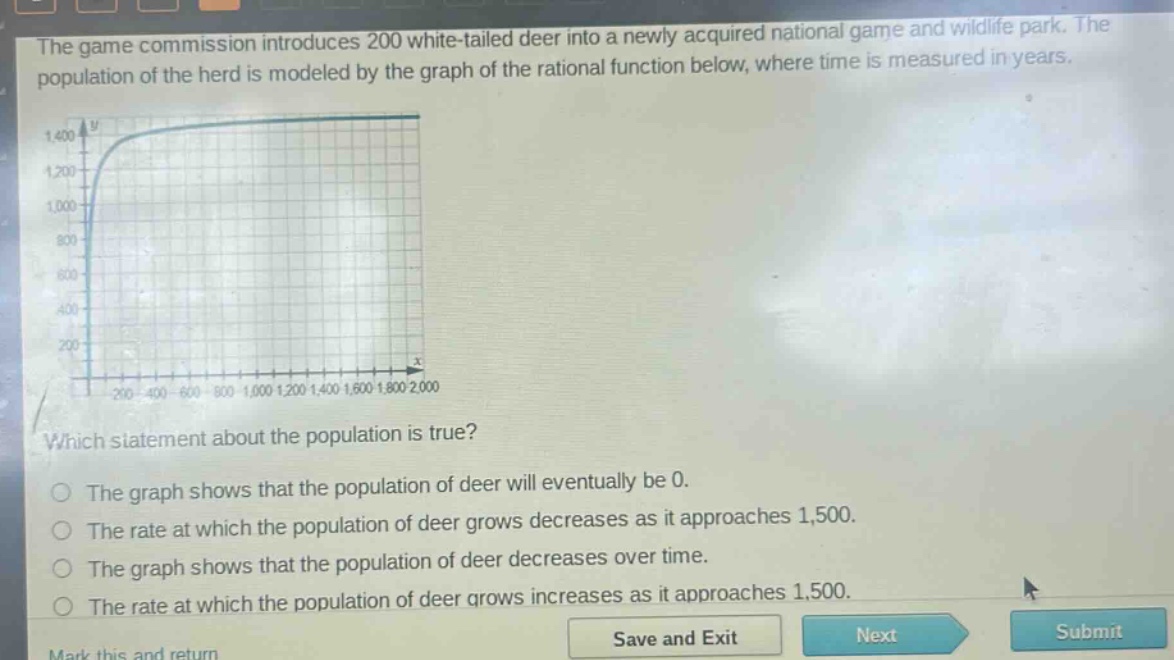
the game commission introduces 200 white - tailed deer into a newly acquired national game and wildlife park. the population of the herd is modeled by the graph of the rational function below, where time is measured in years. which statement about the population is true? the graph shows that the population of deer will eventually be 0. the rate at which the population of deer grows decreases as it approaches 1,500. the graph shows that the population of deer decreases over time. the rate at which the population of deer grows increases as it approaches 1,500.
Answer
Explanation:
Step1: Analyze the graph shape
The graph starts at 200 (initial population) and increases over time and levels - off.
Step2: Understand the concept of rate of growth
The slope of the graph represents the rate of growth. As the graph approaches the horizontal asymptote (around 1500), the slope decreases.
Step3: Evaluate each option
- Option 1: The graph does not approach 0, so this is false.
- Option 2: As the population approaches 1500, the slope of the graph (rate of growth) decreases, so this is true.
- Option 3: The population increases over time, not decreases, so this is false.
- Option 4: The rate of growth decreases as it approaches 1500, not increases, so this is false.
Answer:
The rate at which the population of deer grows decreases as it approaches 1,500.