which graph best represents disruptive selection? graph a graph b graph c
which graph best represents disruptive selection? graph a graph b graph c
Answer
Brief Explanations:
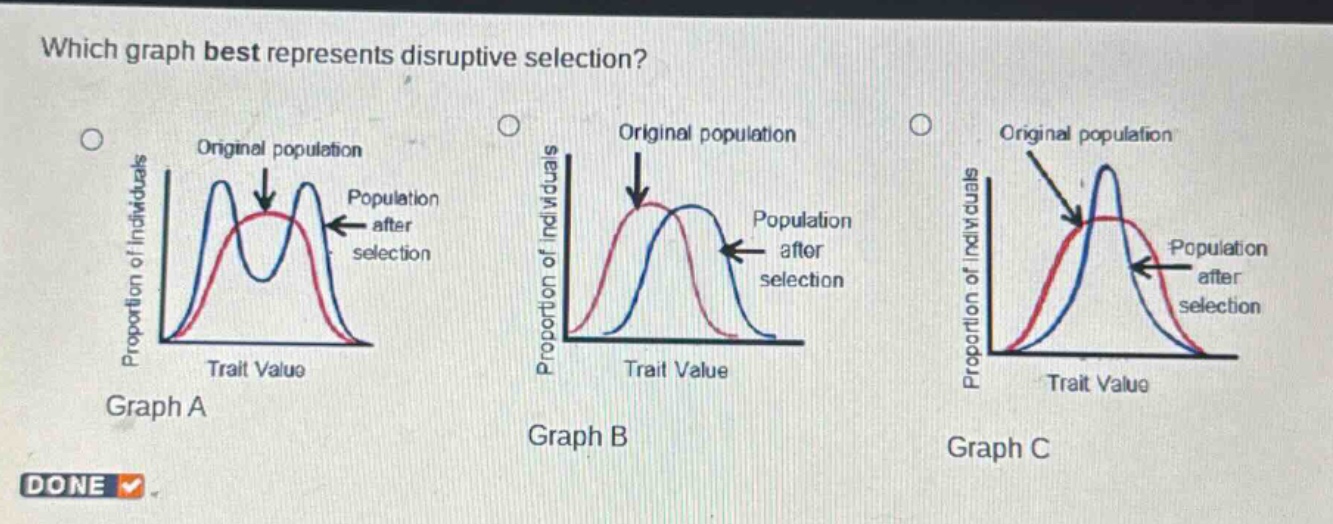
Disruptive selection favors extreme phenotypes over intermediate ones. In the graph representing it, the original single - peaked distribution splits into two peaks at the extremes after selection. Graph A shows the original population with a single peak and the population after selection with two peaks at the extremes of the trait value, which is characteristic of disruptive selection. Graph B represents directional selection (shift of the peak in one direction) and Graph C represents stabilizing selection (narrowing of the peak around the intermediate value).
Answer:
A. Graph A