this graph indicates the percent of the us population that is above or below the recommendation or limits…
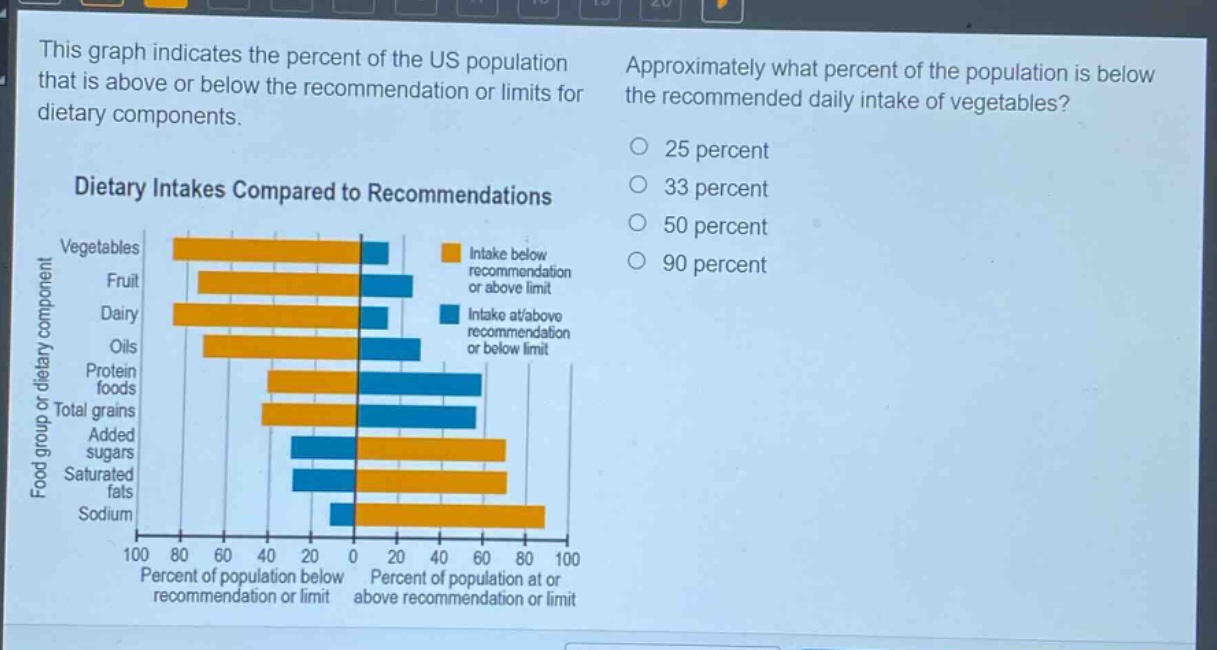
this graph indicates the percent of the us population that is above or below the recommendation or limits for dietary components. approximately what percent of the population is below the recommended daily intake of vegetables? dietary intakes compared to recommendations food group or dietary component vegetables fruit dairy oils protein foods total grains added sugars saturated fats sodium 100 80 60 40 20 0 20 40 60 80 100 percent of population below recommendation or limit percent of population at or above recommendation or limit intake below recommendation or above limit intake at/above recommendation or below limit 25 percent 33 percent 50 percent 90 percent
Answer
Explanation:
Step1: Locate vegetable data
Observe the bar - chart for vegetables.
Step2: Read percentage
The orange bar for vegetables (intake below recommendation) reaches approximately 90 on the x - axis.
Answer:
90 percent