the graph represents a persons heart rate in beats per minute during 30 minutes of exercise. which statement…
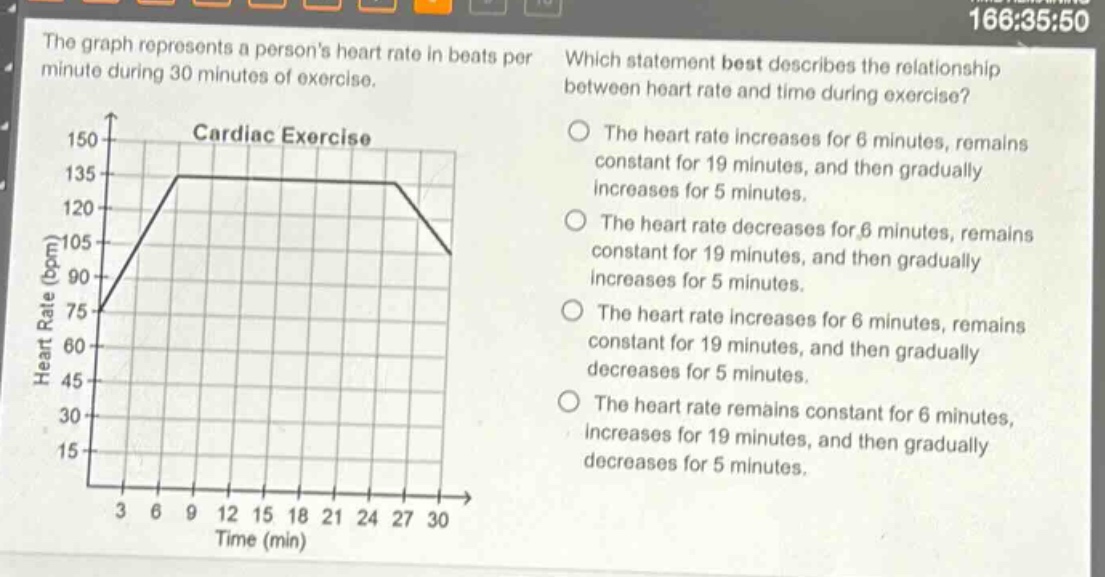
the graph represents a persons heart rate in beats per minute during 30 minutes of exercise. which statement best describes the relationship between heart rate and time during exercise? cardiac exercise the heart rate increases for 6 minutes, remains constant for 19 minutes, and then gradually increases for 5 minutes. the heart rate decreases for 6 minutes, remains constant for 19 minutes, and then gradually increases for 5 minutes. the heart rate increases for 6 minutes, remains constant for 19 minutes, and then gradually decreases for 5 minutes. the heart rate remains constant for 6 minutes, increases for 19 minutes, and then gradually decreases for 5 minutes.
Answer
Answer:
The heart rate increases for 6 minutes, remains constant for 19 minutes, and then gradually decreases for 5 minutes.
Explanation:
Step1: Observe the start - up phase
From 0 to 6 minutes, the heart - rate line is rising, so the heart rate is increasing.
Step2: Observe the middle phase
From 6 to 25 minutes (6 + 19), the heart - rate line is horizontal, so the heart rate is constant.
Step3: Observe the ending phase
From 25 to 30 minutes (25+ 5), the heart - rate line is sloping downwards, so the heart rate is decreasing.