the graph to the right represents the data of this lab using a bar graph. the blue bars best represent the…
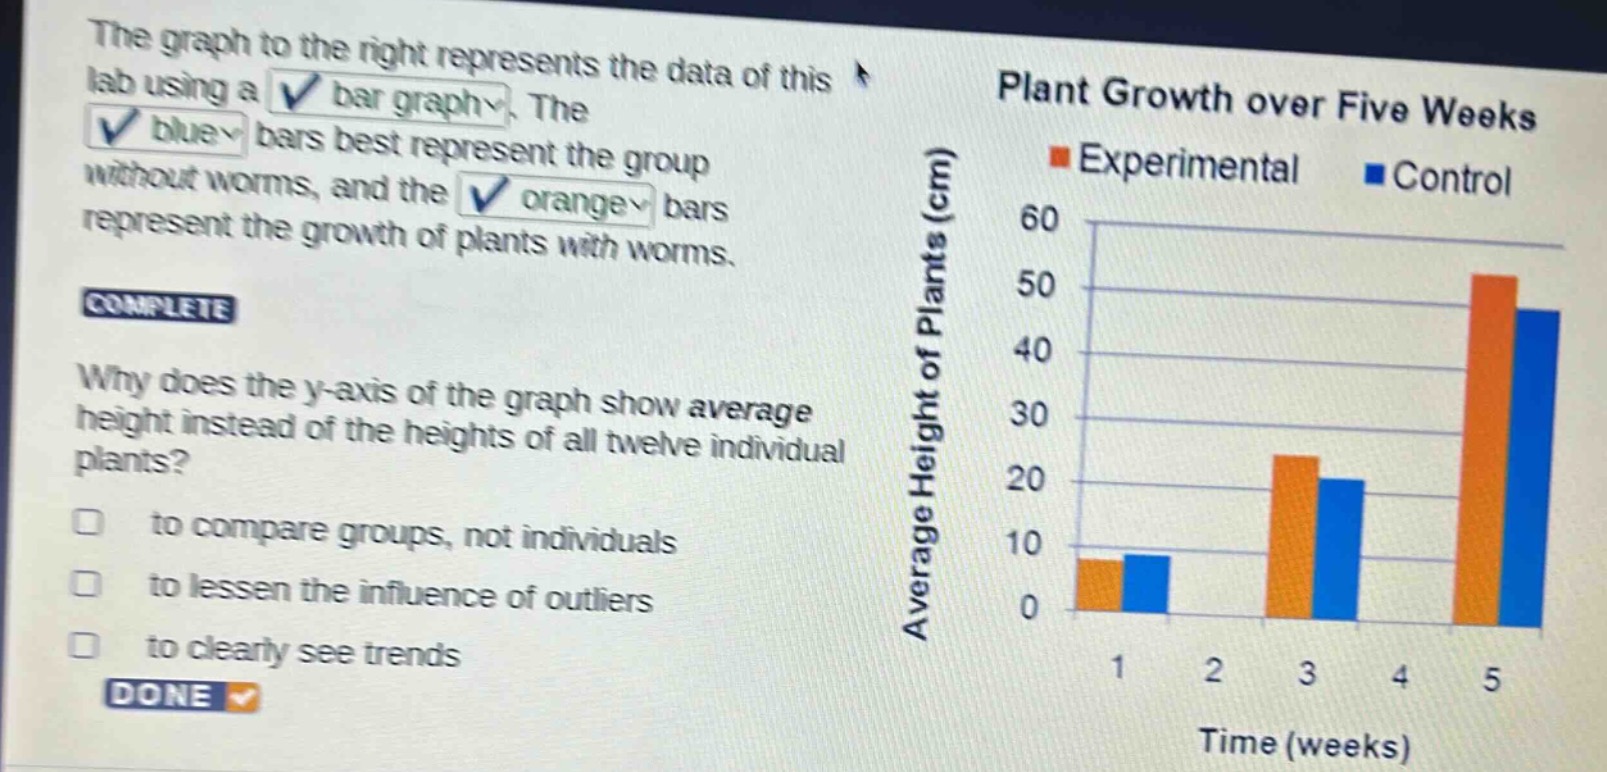
the graph to the right represents the data of this lab using a bar graph. the blue bars best represent the group without worms, and the orange bars represent the growth of plants with worms. complete why does the y - axis of the graph show average height instead of the heights of all twelve individual plants? to compare groups, not individuals to lessen the influence of outliers to clearly see trends done
Answer
Answer:
All of the above
Brief Explanation:
- Comparing groups: Average height helps compare experimental and control groups rather than individual - plant variations.
- Reducing outliers: Outliers in individual - plant heights can skew data, and average lessens their impact.
- Seeing trends: Averaging smooths data, making growth trends over time more visible.