the graph to the right represents the data of this lab using a. the bars best represent the group without…
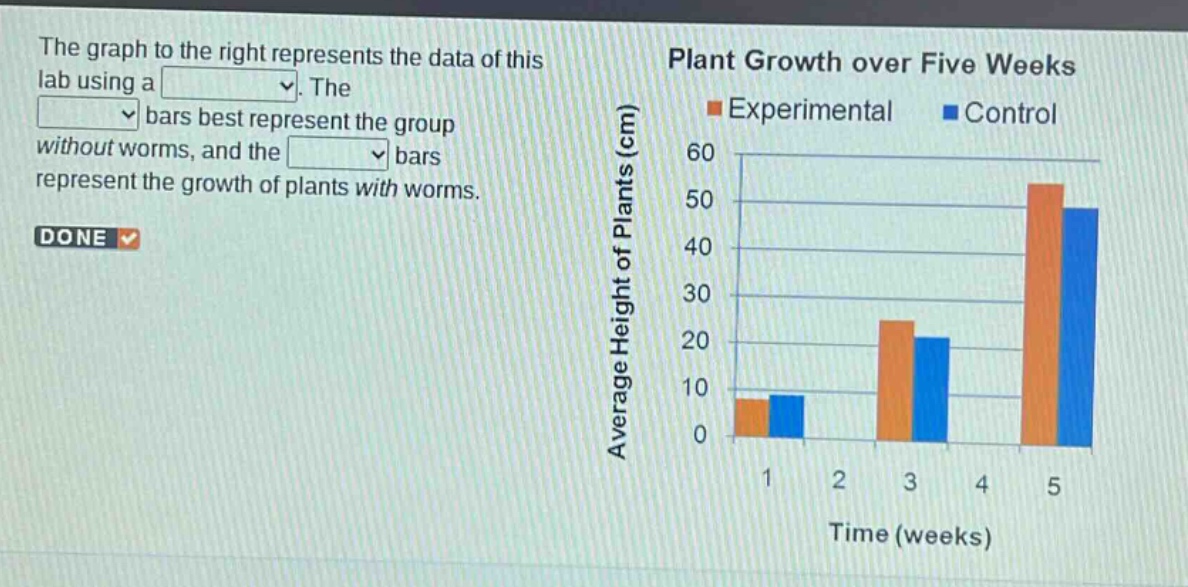
the graph to the right represents the data of this lab using a. the bars best represent the group without worms, and the bars represent the growth of plants with worms. plant growth over five weeks average height of plants (cm) experimental control 60 50 40 30 20 10 0 1 2 3 4 5 time (weeks)
Answer
Brief Explanations:
The graph is a bar - graph as it uses bars to represent data. The blue bars represent the control group (plants without worms) and the orange bars represent the experimental group (plants with worms).
Answer:
The graph to the right represents the data of this lab using a bar - graph. The blue bars best represent the group without worms, and the orange bars represent the growth of plants with worms.