the graph shows the amount of carbon dioxide (co₂) emissions per year over time. students learn that carbon…
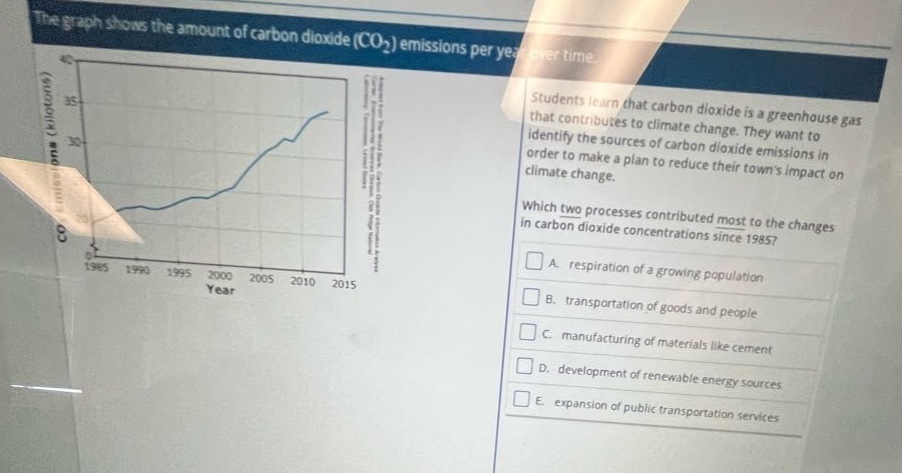
the graph shows the amount of carbon dioxide (co₂) emissions per year over time. students learn that carbon dioxide is a greenhouse gas that contributes to climate change. they want to identify the sources of carbon dioxide emissions in order to make a plan to reduce their towns impact on climate change. which two processes contributed most to the changes in carbon dioxide concentrations since 1985? a. respiration of a growing population b. transportation of goods and people c. manufacturing of materials like cement d. development of renewable energy sources e. expansion of public transportation services
Answer
Brief Explanations:
Respiration of a growing population contributes a small - constant amount of CO₂. Transportation of goods and people, especially with fossil - fuel based vehicles, emits large amounts of CO₂. Manufacturing of materials like cement is a major industrial source of CO₂. Development of renewable energy sources reduces CO₂ emissions. Expansion of public transportation services can reduce CO₂ if it replaces private fossil - fuel vehicle use. Since 1985, transportation and manufacturing have been major contributors to rising CO₂ levels.
Answer:
B. transportation of goods and people C. manufacturing of materials like cement