the graph shows the population of a bacteria in an experiment, measured every hour. which function…
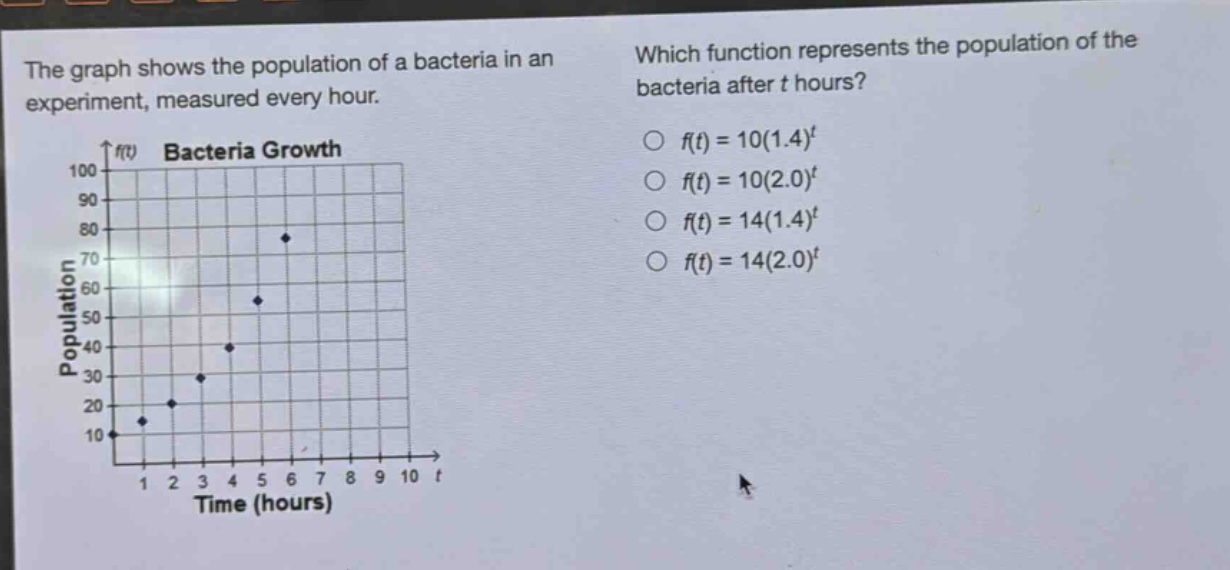
the graph shows the population of a bacteria in an experiment, measured every hour. which function represents the population of the bacteria after t hours? f(t) = 10(1.4)^t f(t) = 10(2.0)^t f(t) = 14(1.4)^t f(t) = 14(2.0)^t
Answer
Explanation:
Step1: Identify initial - population
When (t = 0), from the graph, the population (f(0)=10). The general form of an exponential - growth function is (f(t)=a\cdot b^{t}), where (a) is the initial population. So (a = 10).
Step2: Check the growth factor
Let's take another point, say (t = 1). From the graph, when (t = 1), (f(1)\approx14). Substitute (t = 1) into (f(t)=a\cdot b^{t}), we get (f(1)=a\cdot b). Since (a = 10), then (10b\approx14), so (b=\frac{14}{10}=1.4).
Answer:
(f(t)=10(1.4)^{t})