the graph shows the recorded heights of a plant in a soil experiment. which statements describe the plant…
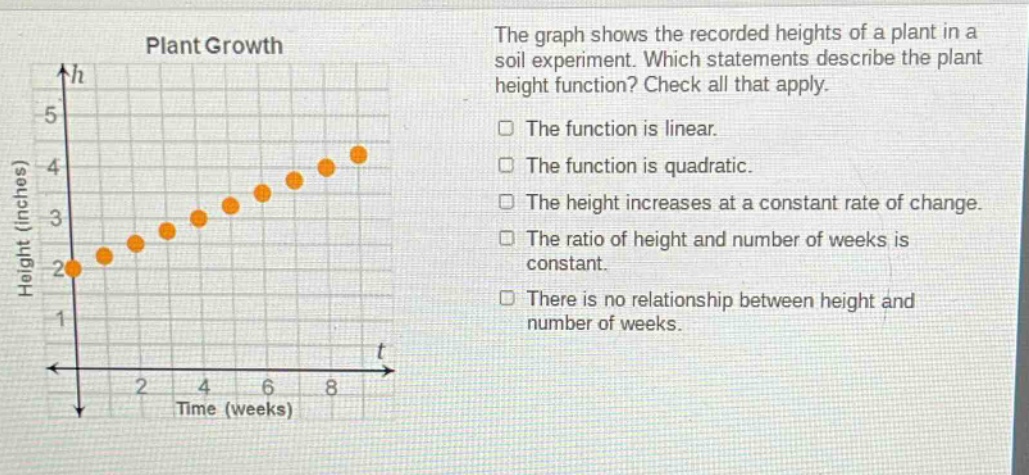
the graph shows the recorded heights of a plant in a soil experiment. which statements describe the plant height function? check all that apply. the function is linear. the function is quadratic. the height increases at a constant rate of change. the ratio of height and number of weeks is constant. there is no relationship between height and number of weeks.
Answer
Answer:
- The function is linear.
- The height increases at a constant rate of change.
Explanation:
Step1: Analyze the graph shape
The points on the graph form a straight - line pattern. In a linear function, the graph is a straight line. So the function is linear.
Step2: Check rate of change
The height of the plant increases by approximately the same amount each week. For example, from week 0 to week 1, the height increases by about 0.5 inches, and this pattern continues. A constant rate of change is a characteristic of a linear function. So the height increases at a constant rate of change.
Step3: Rule out other options
The graph does not have the parabolic shape of a quadratic function. The ratio of height and number of weeks is not constant (it is the slope which is constant for linear functions but not in the sense of a simple ratio). And clearly, there is a relationship between height and number of weeks as the height changes with time.