hayley is growing pumpkins in her garden this summer and is so excited when the first tiny green pumpkin…
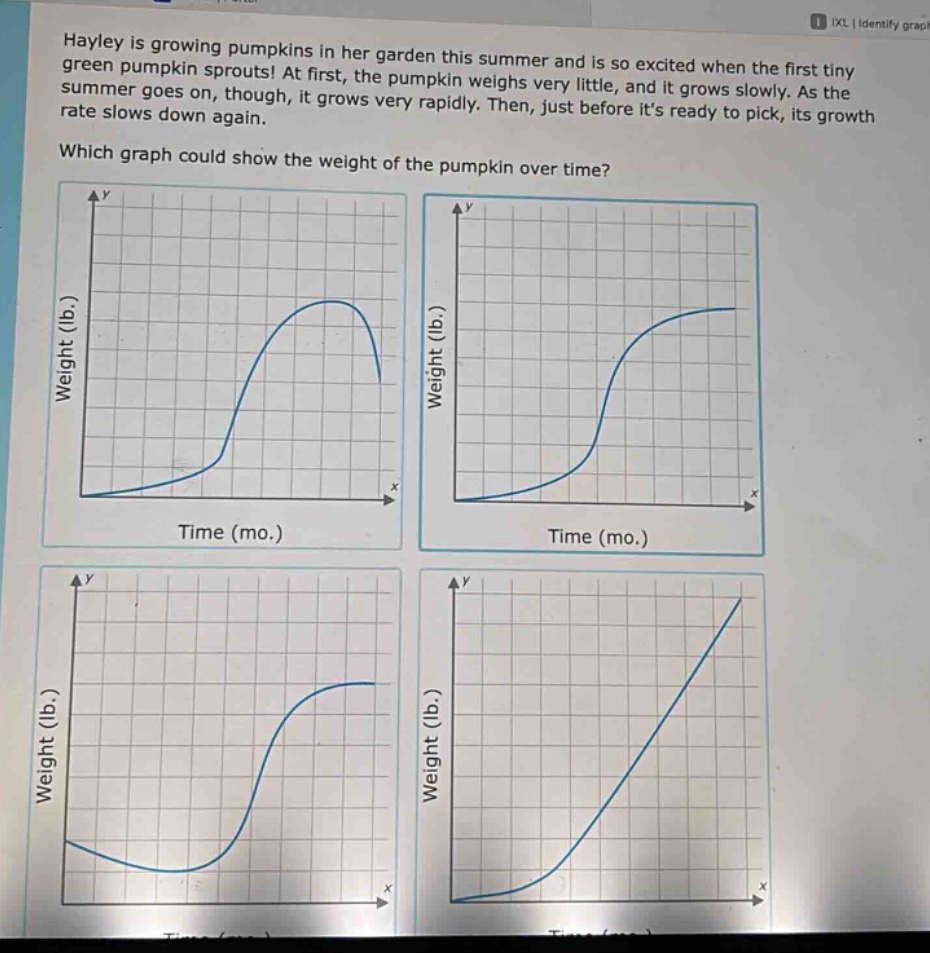
hayley is growing pumpkins in her garden this summer and is so excited when the first tiny green pumpkin sprouts! at first, the pumpkin weighs very little, and it grows slowly. as the summer goes on, though, it grows very rapidly. then, just before its ready to pick, its growth rate slows down again. which graph could show the weight of the pumpkin over time?
Answer
Answer:
The second - graph (top - right graph)
Explanation:
Step1: Analyze growth description
The pumpkin grows slowly at first, then rapidly, then slows down before picking.
Step2: Evaluate first graph
The first graph has a decrease at the end which is not in line with the description.
Step3: Evaluate second graph
The second graph has an initial slow growth, then a rapid increase, and then a leveling - off as growth slows down, matching the description.
Step4: Evaluate third graph
The third graph starts with a decrease which is not correct as the pumpkin's weight should increase over time.
Step5: Evaluate fourth graph
The fourth graph has a constant rate of increase which does not match the changing growth rate described.