a herd of bison currently has 55 members. based on the available resources, biologists estimate that the…
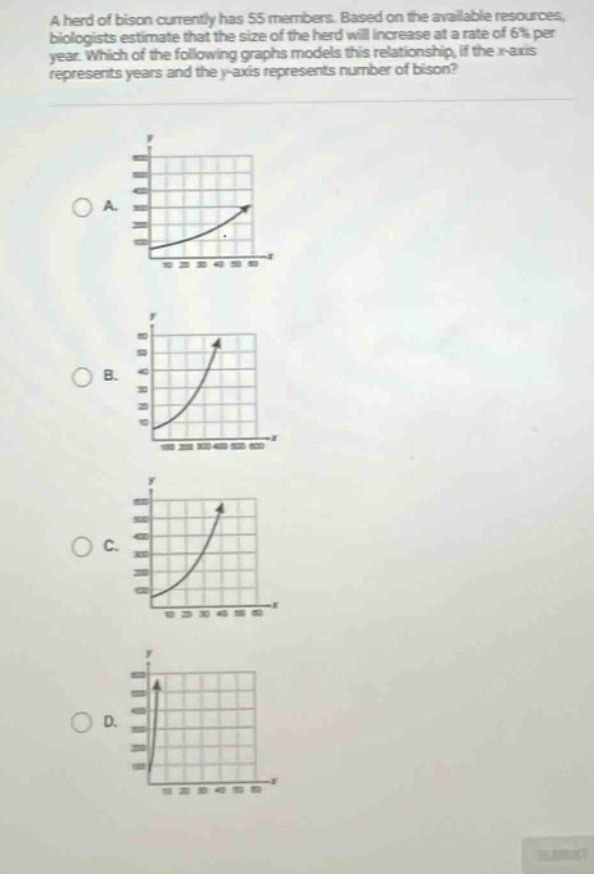
a herd of bison currently has 55 members. based on the available resources, biologists estimate that the size of the herd will increase at a rate of 6% per year. which of the following graphs models this relationship, if the x - axis represents years and the y - axis represents number of bison?
Answer
Explanation:
Step1: Identify the growth - model formula
The population growth formula for exponential growth is $y = a(1 + r)^x$, where $a$ is the initial amount, $r$ is the growth rate as a decimal, and $x$ is the number of time - periods. Here, $a = 55$ and $r=0.06$. So the function is $y = 55(1 + 0.06)^x=55\times1.06^x$.
Step2: Analyze the initial condition
When $x = 0$ (the starting year), $y=55\times1.06^0 = 55$. So the graph should pass through the point $(0,55)$.
Step3: Analyze the growth rate
Since the growth rate $r = 0.06>0$, the function is an exponential growth function. The graph of an exponential growth function $y = a\times b^x$ ($b>1$) starts from the $y$ - intercept and curves upwards. Also, the $x$-axis represents years and should have reasonable values for years (non - negative integers in this context).
Looking at the options:
- Option A: The graph starts above the origin and has a reasonable upward - curving shape for exponential growth with an appropriate scale on the $x$ - axis.
- Option B: The scale on the $x$ - axis ($100,200,300,\cdots$) is not appropriate for representing years in this context as it makes the growth seem too slow for the given growth rate over a reasonable number of years.
- Option C: The scale on the $x$ - axis is appropriate, but the growth seems too steep compared to what would be expected from a 6% growth rate.
- Option D: The graph starts below the origin which is not correct since the initial number of bison is 55 (a positive value).
Answer:
A.