what kind of display would be the best way to represent the data below?\n|type of species|critically…
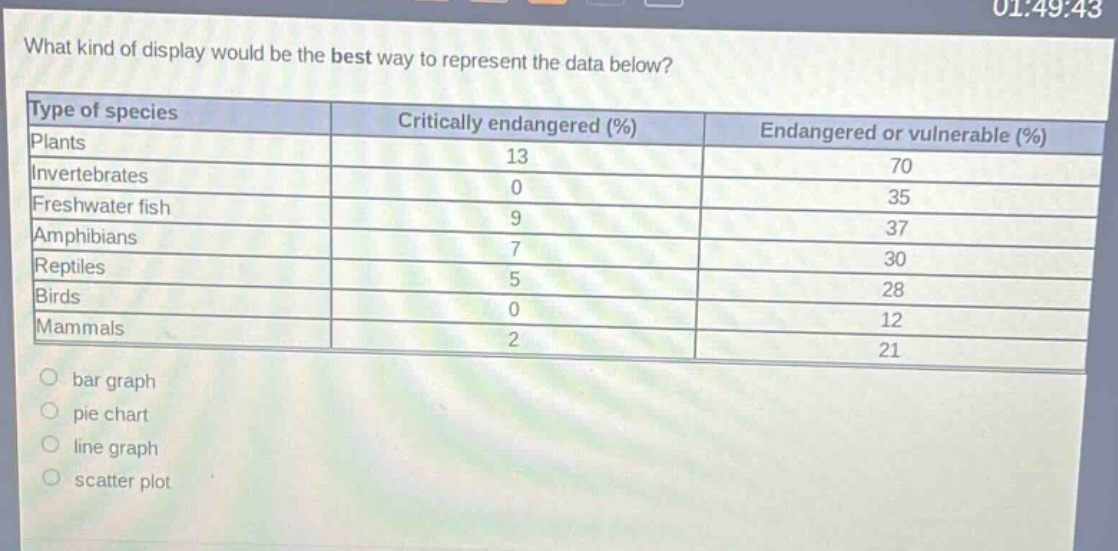
what kind of display would be the best way to represent the data below?\n|type of species|critically endangered (%)|endangered or vulnerable (%)|\n|--|--|--|\n|plants|13|70|\n|invertebrates|0|35|\n|freshwater fish|9|37|\n|amphibians|7|30|\n|reptiles|5|28|\n|birds|0|12|\n|mammals|2|21|\nbar graph\npie chart\nline graph\nscatter plot
Answer
Brief Explanations:
A bar graph is ideal for comparing discrete categories (types of species) with two - separate data series (critically endangered and endangered/vulnerable percentages). A pie chart is for showing parts of a whole, a line graph for trends over time, and a scatter plot for relationships between two variables. Here we are comparing categories and values for two different attributes per category.
Answer:
A. bar graph