what kind of display would be the best way to represent the data below?\n|type of species|critically…
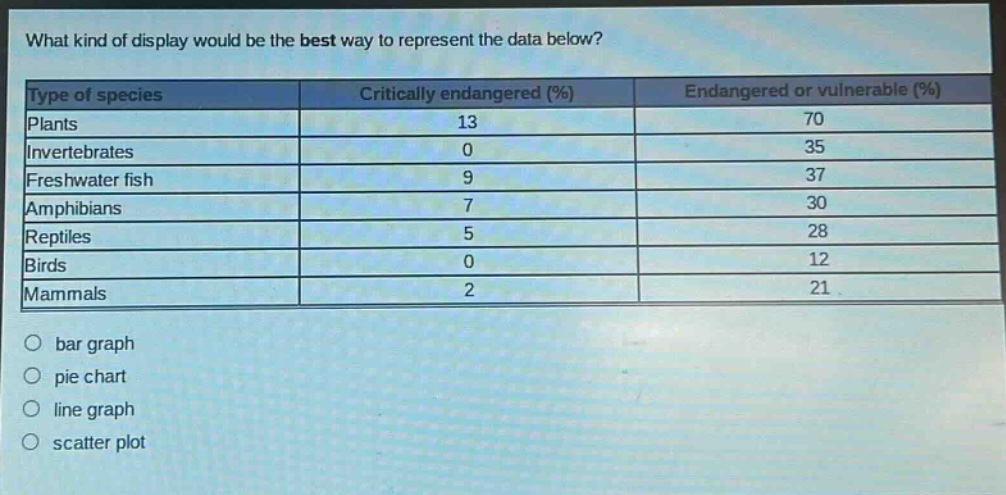
what kind of display would be the best way to represent the data below?\n|type of species|critically endangered (%)|endangered or vulnerable (%)|\n|--|--|--|\n|plants|13|70|\n|invertebrates|0|35|\n|freshwater fish|9|37|\n|amphibians|7|30|\n|reptiles|5|28|\n|birds|0|12|\n|mammals|2|21|\no bar graph\no pie chart\no line graph\no scatter plot
Answer
Brief Explanations:
Un gráfico de barras es ideal para comparar valores entre diferentes categorías (tipos de especies en este caso) y mostrar dos variables (porcentaje de en peligro crítico y en peligro/vulnerable). Un gráfico circular se utiliza mejor para mostrar proporciones en relación al total, una gráfica de línea para mostrar tendencias a lo largo del tiempo y un diagrama de dispersión para mostrar la relación entre dos variables numéricas.
Answer:
bar graph