in this lab, you collected data at the end of weeks 1, 3, and 5. suppose you had collected data every day…
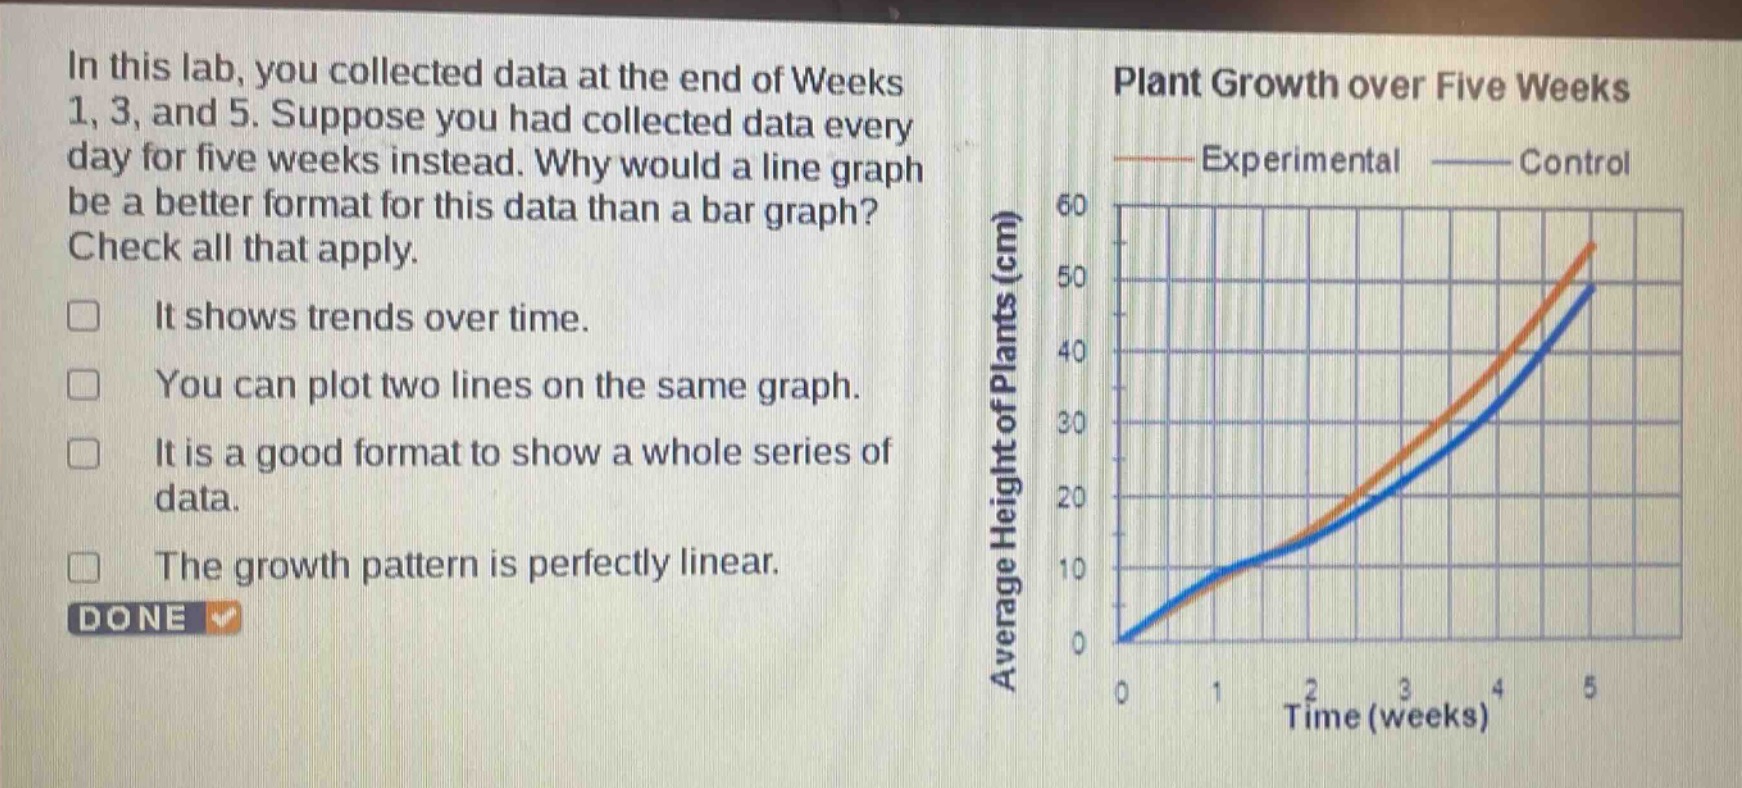
in this lab, you collected data at the end of weeks 1, 3, and 5. suppose you had collected data every day for five weeks instead. why would a line graph be a better format for this data than a bar graph? check all that apply. it shows trends over time. you can plot two lines on the same graph. it is a good format to show a whole series of data. the growth pattern is perfectly linear. done
Answer
Brief Explanations:
- Line graphs are ideal for showing trends over time, which is relevant when data is collected daily for five - weeks.
- They can effectively display a whole series of data points. Plotting two lines (experimental and control) on the same graph is also a common and useful feature of line graphs. The growth pattern is not always perfectly linear, so that is not a reason for preferring line graphs.
Answer:
- It shows trends over time.
- You can plot two lines on the same graph.
- It is a good format to show a whole series of data.