look at the maps. the top map shows carbon dioxide released by wildfires. the bottom map shows how the…
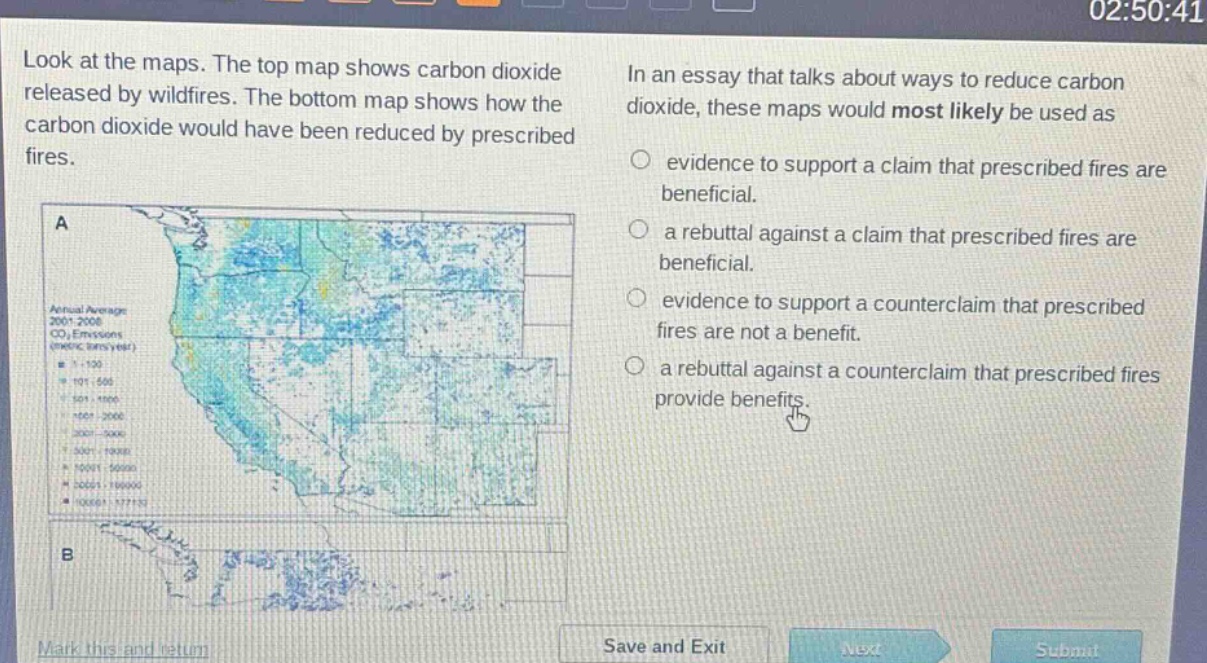
look at the maps. the top map shows carbon dioxide released by wildfires. the bottom map shows how the carbon dioxide would have been reduced by prescribed fires. in an essay that talks about ways to reduce carbon dioxide, these maps would most likely be used as evidence to support a claim that prescribed fires are beneficial. a rebuttal against a claim that prescribed fires are beneficial. evidence to support a counterclaim that prescribed fires are not a benefit. a rebuttal against a counterclaim that prescribed fires provide benefits.
Answer
Brief Explanations:
The top - map shows CO2 from wildfires and the bottom - map shows CO2 reduction by prescribed fires. This indicates that prescribed fires can reduce CO2 emissions, which supports the claim that they are beneficial. So, these maps are evidence for the claim that prescribed fires are beneficial.
Answer:
A. evidence to support a claim that prescribed fires are beneficial.