a marine biologist is studying the humpback whale population around the hawaiian islands. in the summer…
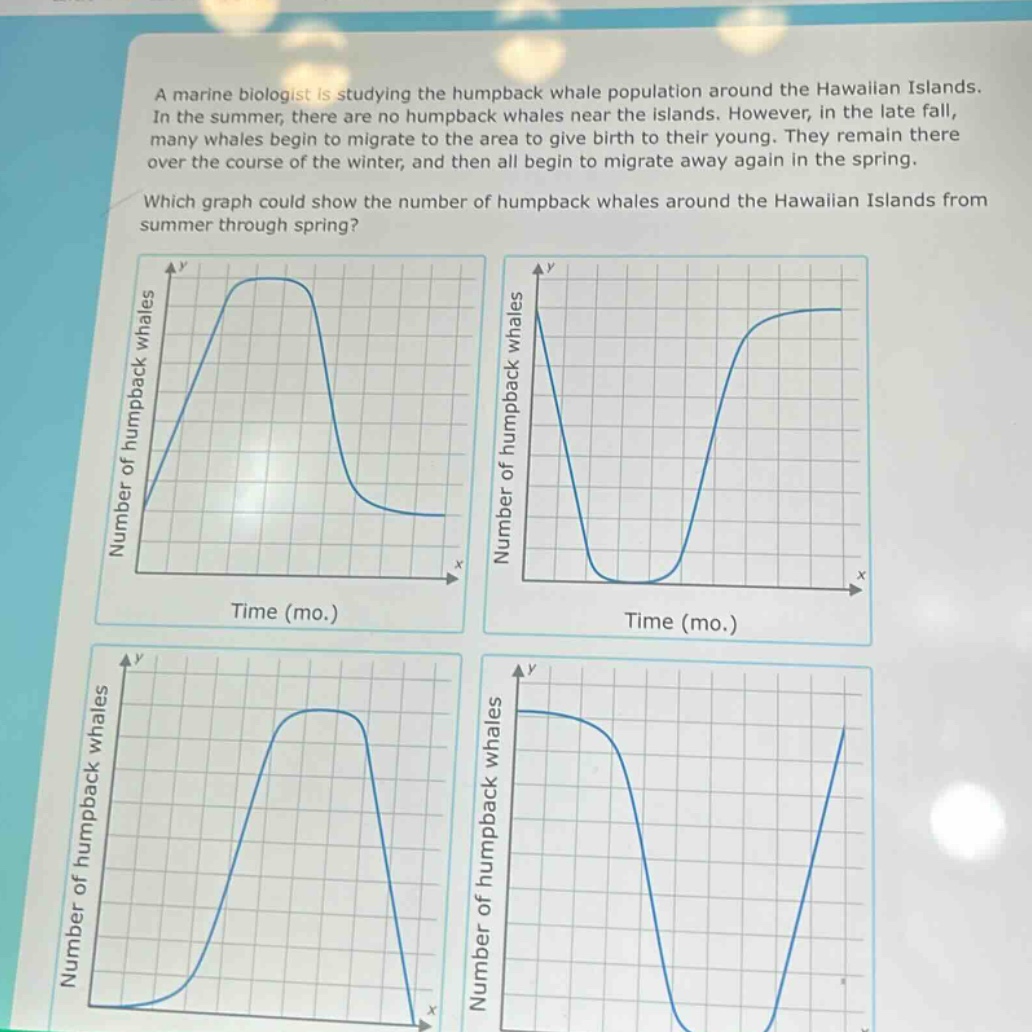
a marine biologist is studying the humpback whale population around the hawaiian islands. in the summer, there are no humpback whales near the islands. however, in the late fall, many whales begin to migrate to the area to give birth to their young. they remain there over the course of the winter, and then all begin to migrate away again in the spring. which graph could show the number of humpback whales around the hawaiian islands from summer through spring?
Answer
Explanation:
Step1: Analyze summer condition
In summer, number of whales is 0. So the graph should start at 0 on the y - axis (number of whales) for the start - time corresponding to summer.
Step2: Analyze late - fall to winter condition
In late fall, whales migrate to the area, so the number of whales increases. Then they remain in winter, so the number stays high for a period.
Step3: Analyze spring condition
In spring, whales migrate away, so the number of whales decreases back to 0.
Answer:
The bottom - left graph. It starts at 0 (summer), increases (late fall), stays high (winter) and then decreases back to 0 (spring).