model 2 - color variations in moths in great britain\npeppered moth frequency\n8. refer to the graph of…
model 2 - color variations in moths in great britain\npeppered moth frequency\n8. refer to the graph of peppered moth frequency in model 2.\na. which moth color was more prevalent before 1850?\nb. which color was more prevalent between 1900 and 1950?\n9. describe the change in the percentage of light - colored moths and dark - colored moths between 1850 and 1900.\n10. describe the change in the percentage of light - colored moths and dark - colored moths between 1950 and 2000.\n11. during the industrial revolution through the mid - 20th century, factories and power plants, which burned coal, produced large quantities of soot and smog. near industrialized areas, black powder covered surfaces, including the moth habitat.\na. which color moth would have a better chance of surviving predation (better camouflage to hide from predators) on this dark surface?\nb. how does this help explain the change in the colors of the moth population shown in model 2?
Answer
Explanation:
Step1: Analyze graph before 1850
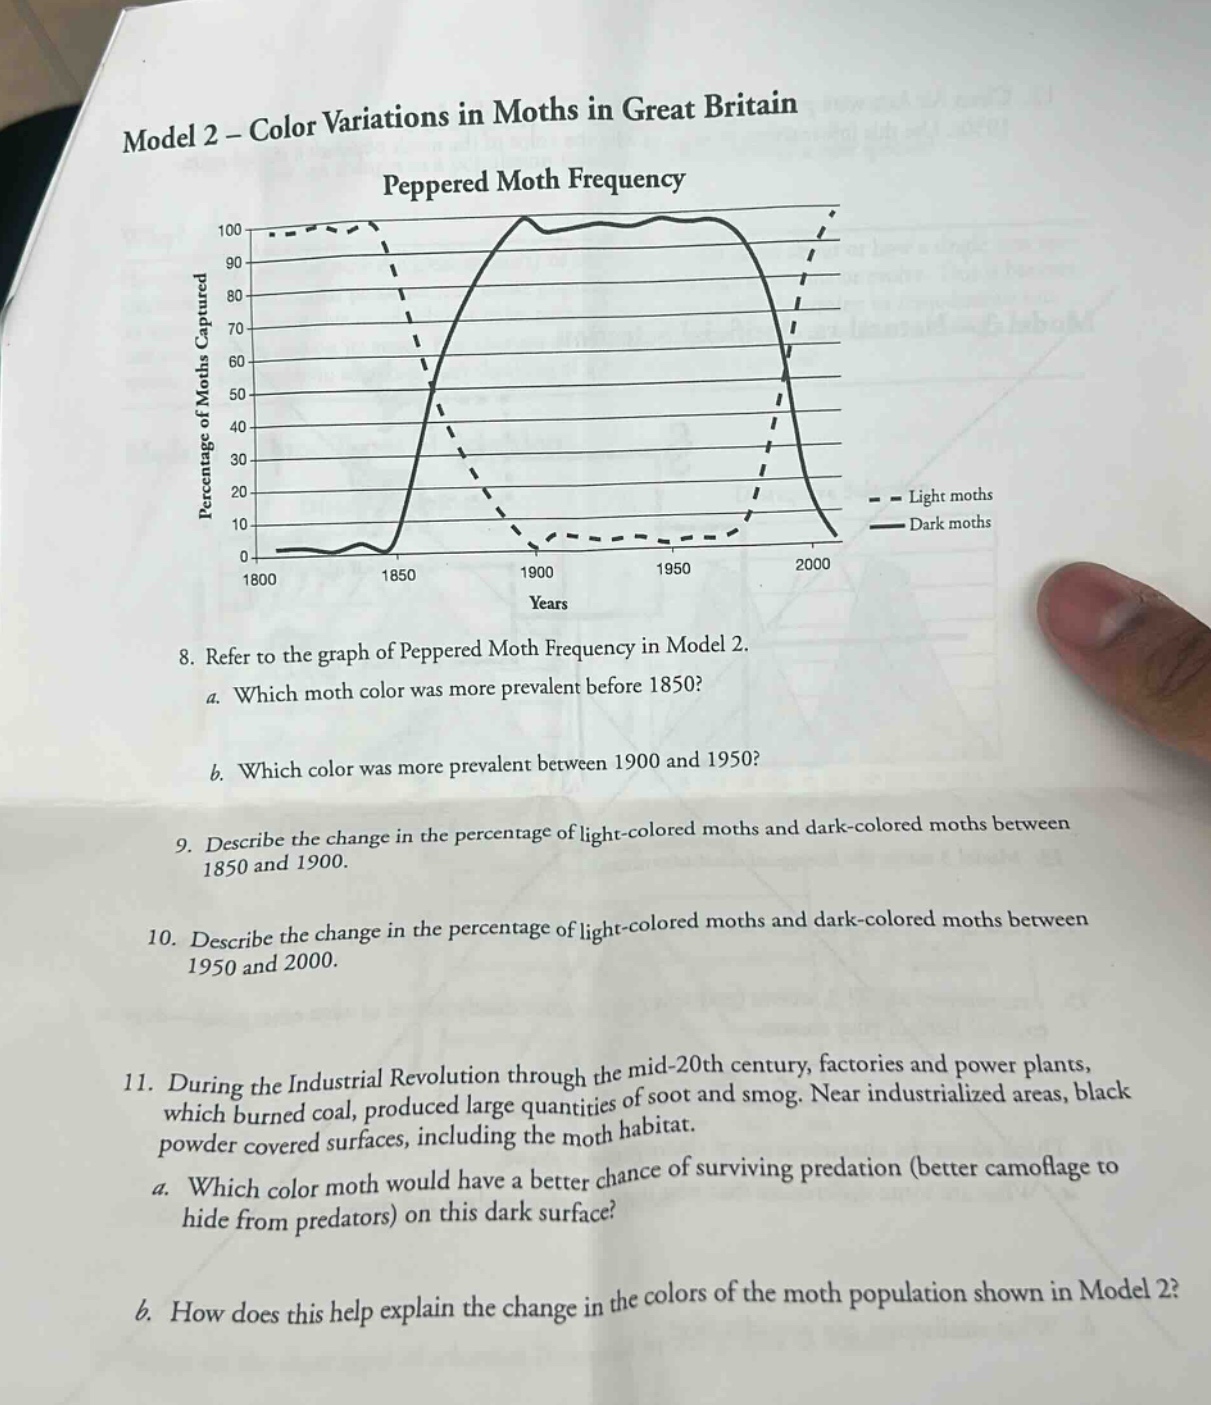
Before 1850, the percentage of light - moths is above 90% while dark - moths is below 10%. So light moths are more prevalent.
Step2: Analyze graph between 1900 and 1950
Between 1900 and 1950, the percentage of dark moths is around 90% and light moths is around 10%. So dark moths are more prevalent.
Step3: Analyze change 1850 - 1900
From 1850 to 1900, the percentage of light moths decreased from above 90% to below 10%, while the percentage of dark moths increased from below 10% to above 90%.
Step4: Analyze change 1950 - 2000
From 1950 to 2000, the percentage of dark moths decreased from above 90% to below 10%, while the percentage of light moths increased from below 10% to above 90%.
Step5: Consider survival on dark surface
On a dark surface, dark moths would have better camouflage and a better chance of surviving predation.
Step6: Explain population change
During the Industrial Revolution, the darkening of the environment due to soot and smog made dark moths more camouflaged, increasing their survival rate and population. As the environment improved after 1950, light moths became better - camouflaged again, leading to their population increase.
Answer:
- a. Light moths b. Dark moths
- The percentage of light - colored moths decreased and the percentage of dark - colored moths increased.
- The percentage of dark - colored moths decreased and the percentage of light - colored moths increased.
- a. Dark moths b. During the Industrial Revolution, the dark environment favored dark moths, increasing their population. After 1950, as the environment improved, light moths were more favored, increasing their population.