modeling inheritance\nplant breeders and animal breeders use a method for predicting how often traits will…
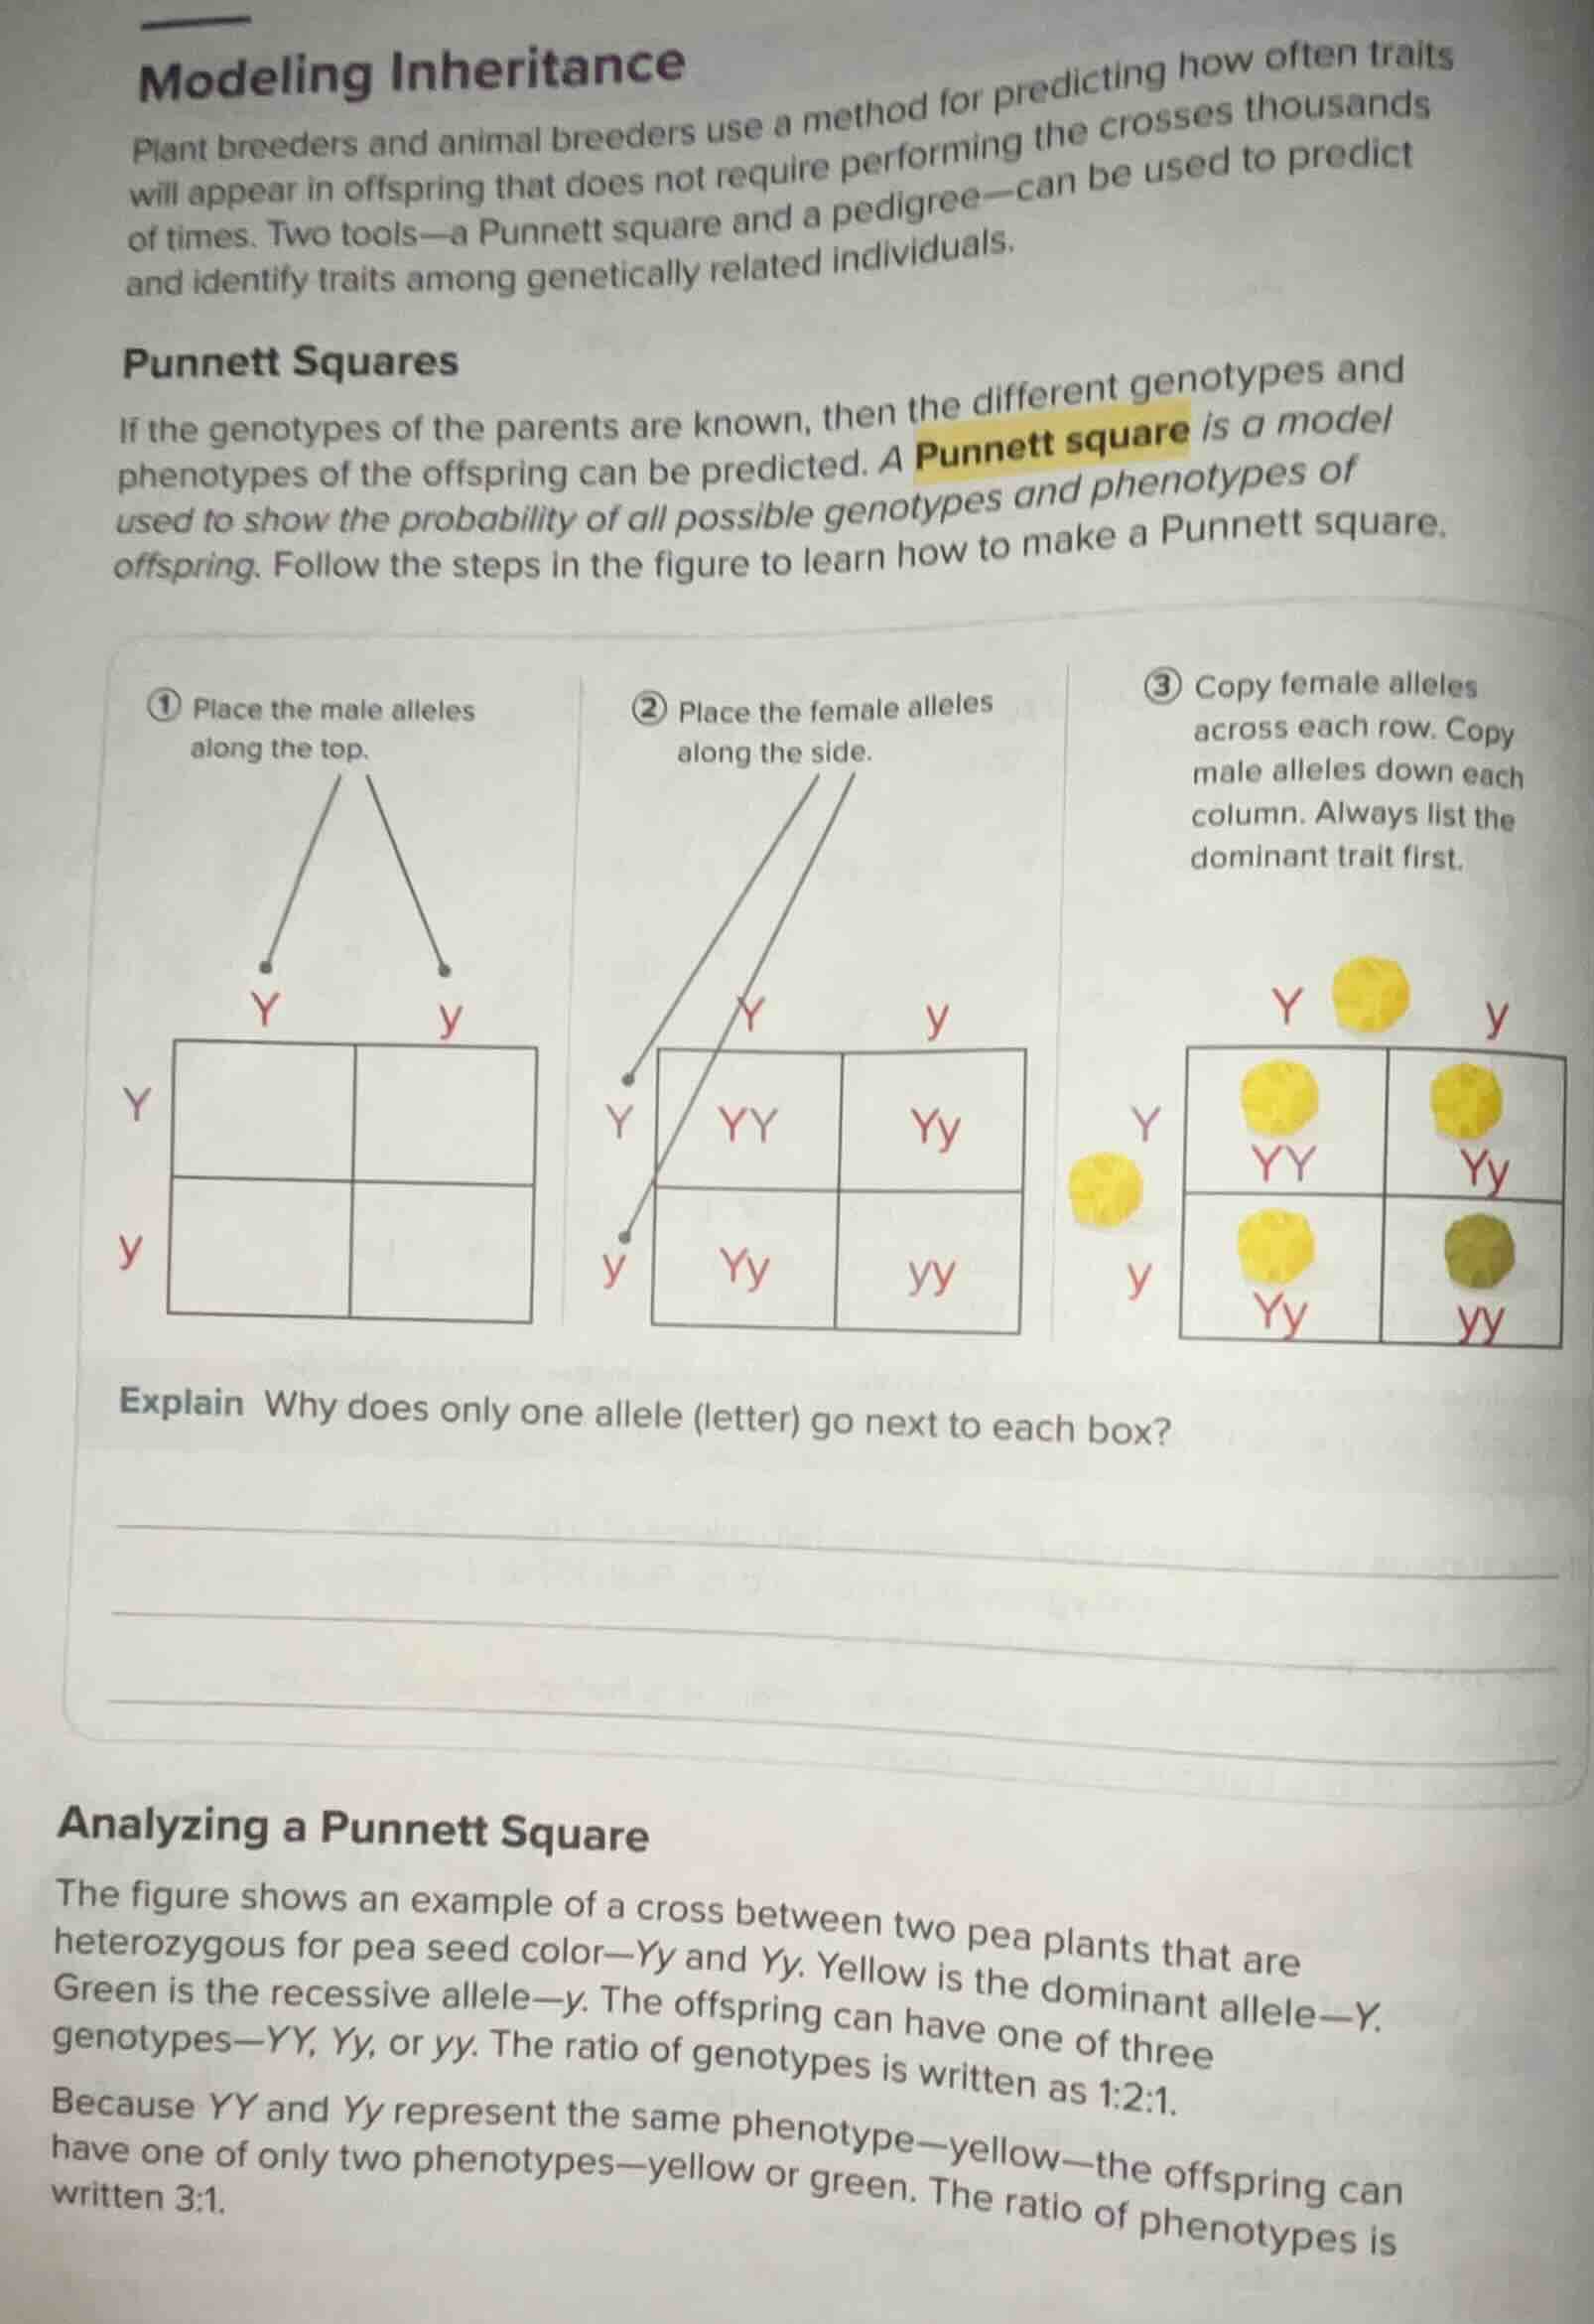
modeling inheritance\nplant breeders and animal breeders use a method for predicting how often traits will appear in offspring that does not require performing the crosses thousands of times. two tools—a punnett square and a pedigree—can be used to predict and identify traits among genetically related individuals.\npunnett squares\nif the genotypes of the parents are known, then the different genotypes and phenotypes of the offspring can be predicted. a punnett square is a model used to show the probability of all possible genotypes and phenotypes of offspring. follow the steps in the figure to learn how to make a punnett square.\n① place the male alleles along the top.\n② place the female alleles along the side.\n③ copy female alleles across each row. copy male alleles down each column. always list the dominant trait first.\nexplain why does only one allele (letter) go next to each box?\n\nanalyzing a punnett square\nthe figure shows an example of a cross between two pea plants that are heterozygous for pea seed color—yy and yy. yellow is the dominant allele—y. green is the recessive allele—y. the offspring can have one of three genotypes—yy, yy, or yy. the ratio of genotypes is written as 1:2:1.\nbecause yy and yy represent the same phenotype—yellow—the offspring can have one of only two phenotypes—yellow or green. the ratio of phenotypes is written 3:1.
Answer
Brief Explanations:
Los organismos diploides reciben un alelo de cada padre (uno del padre, uno de la madre) para cada rasgo. En la formación de gametos, la meiosis separa los alelos, de modo que cada gameto (espermatozoide o óvulo) lleva solo un alelo para cada rasgo. Cuando los gametos se fusionan en la fecundación, el embrión recibe un alelo de cada padre, pero en el diagrama del cuadrado de Punnett, cada casilla representa un gameto potencial o la combinación al recibir un alelo de cada progenitor. Por lo tanto, solo un alelo se coloca junto a cada casilla porque cada gameto contribuye un solo alelo para el rasgo, y el cuadrado de Punnett modela la combinación de un alelo paterno y uno materno en cada descendiente, con cada casilla representando la combinación de un alelo del padre (de la fila) y uno de la madre (de la columna), pero en la etapa de colocar los alelos de los progenitores, cada "ramita" representa un gameto con un solo alelo.
Answer:
Cada organismo diploide recibe un alelo de cada padre para un rasgo. Durante la meiosis, los alelos se separan, y cada gameto (espermatozoide/óvulo) lleva solo un alelo para el rasgo. En el cuadrado de Punnett, las filas/columnas representan gametos de cada progenitor, y cada casilla modela la combinación de un gameto paterno y uno materno. Así, solo un alelo se coloca junto a cada casilla porque cada gameto contribuye un solo alelo, y el cuadrado de Punnett muestra la probabilidad de combinaciones de un alelo de cada progenitor en el descendiente.