paramecium contractile vacuole contractions\nsalt concentration outside paramecium\tcontractions per…
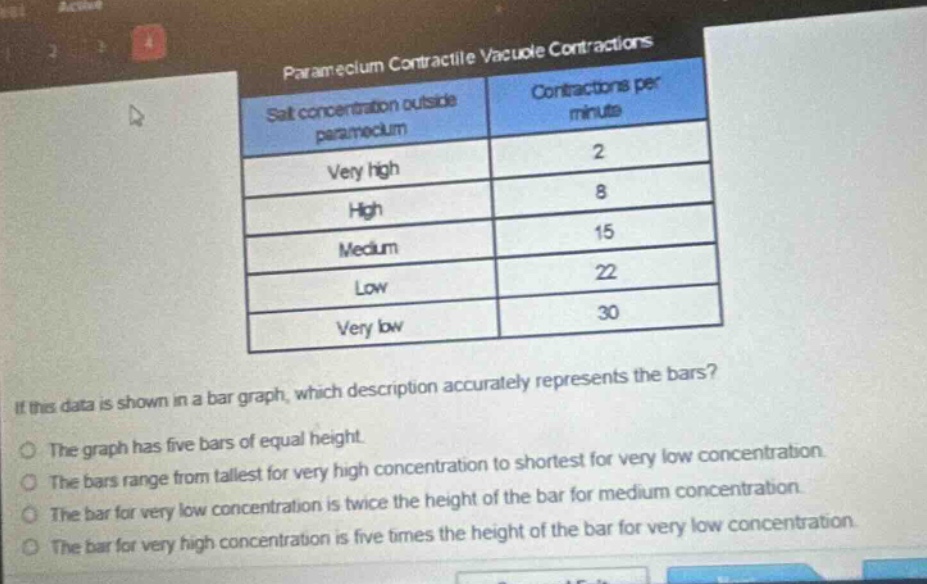
paramecium contractile vacuole contractions\nsalt concentration outside paramecium\tcontractions per minute\nvery high\t2\nhigh\t8\nmedium\t15\nlow\t22\nvery low\t30\nif this data is shown in a bar graph, which description accurately represents the bars?\nthe graph has five bars of equal height.\nthe bars range from tallest for very high concentration to shortest for very low concentration.\nthe bar for very low concentration is twice the height of the bar for medium concentration.\nthe bar for very high concentration is five times the height of the bar for very low concentration.
Answer
Explanation:
Step1: Analyze bar - height relationship
The number of contractions per minute represents the height of the bars in the bar - graph. The salt concentration outside paramecium values are: Very high (2 contractions per minute), High (8 contractions per minute), Medium (15 contractions per minute), Low (22 contractions per minute), Very low (30 contractions per minute).
Step2: Check each option
- Option 1: The values are different, so the bars are not of equal height.
- Option 2: The bar for very high concentration is the shortest and for very low concentration is the tallest, so this is wrong.
- Option 3: The bar for very low concentration (30) is ( \frac{30}{15}=2) times the height of the bar for medium concentration (15). This option is correct.
- Option 4: The bar for very high concentration (2) is (\frac{2}{30}=\frac{1}{15}) of the height of the bar for very low concentration, not five times.