reported chlamydia cases by age group and sex (2015)\nmales females\nrate per 100,000\naccording to the…
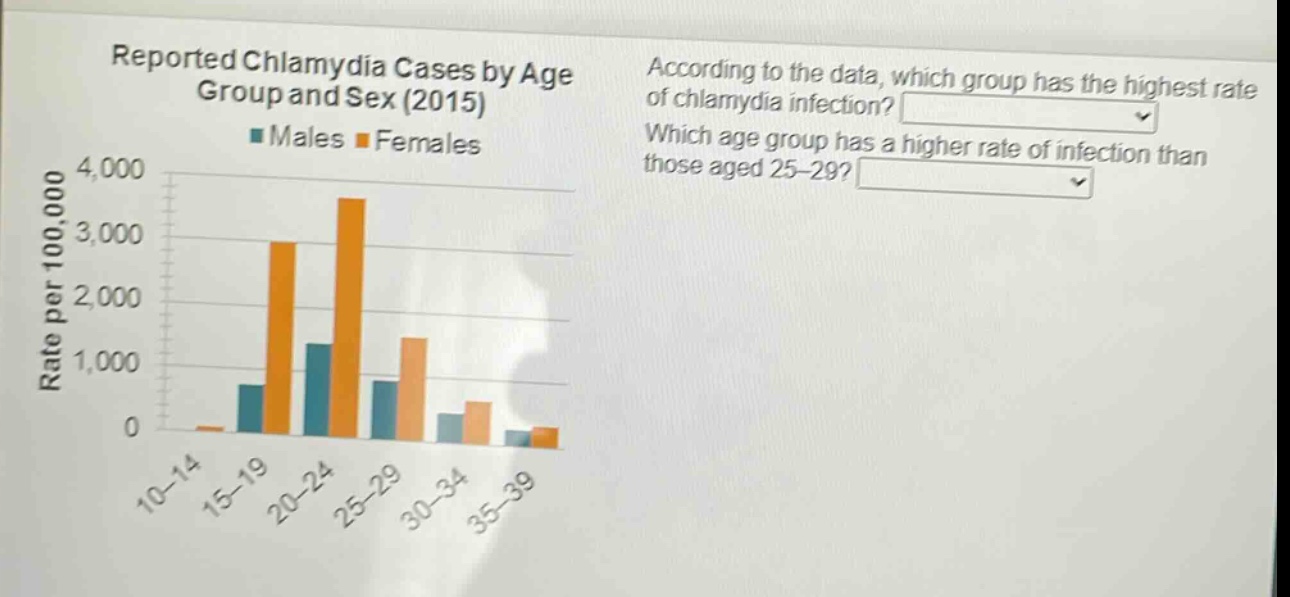
reported chlamydia cases by age group and sex (2015)\nmales females\nrate per 100,000\naccording to the data, which group has the highest rate of chlamydia infection?\nwhich age group has a higher rate of infection than those aged 25 - 29?
Answer
Explanation:
Step1: Observe the bar - chart
By looking at the bar - chart showing the rate of chlamydia infection per 100,000 for different age groups and sexes, we can compare the heights of the bars for each age group.
Step2: Identify the highest - rate group
The highest bars are in the 20 - 24 age group, indicating that this age group has the highest rate of chlamydia infection.
Step3: Compare with 25 - 29 age group
The bars for the 20 - 24 age group are higher than those for the 25 - 29 age group.
Answer:
The group with the highest rate of chlamydia infection: 20 - 24 The age group with a higher rate of infection than those aged 25 - 29: 20 - 24