select all the correct answers. this graph represents four ecosystems. each ecosystem has a different number…
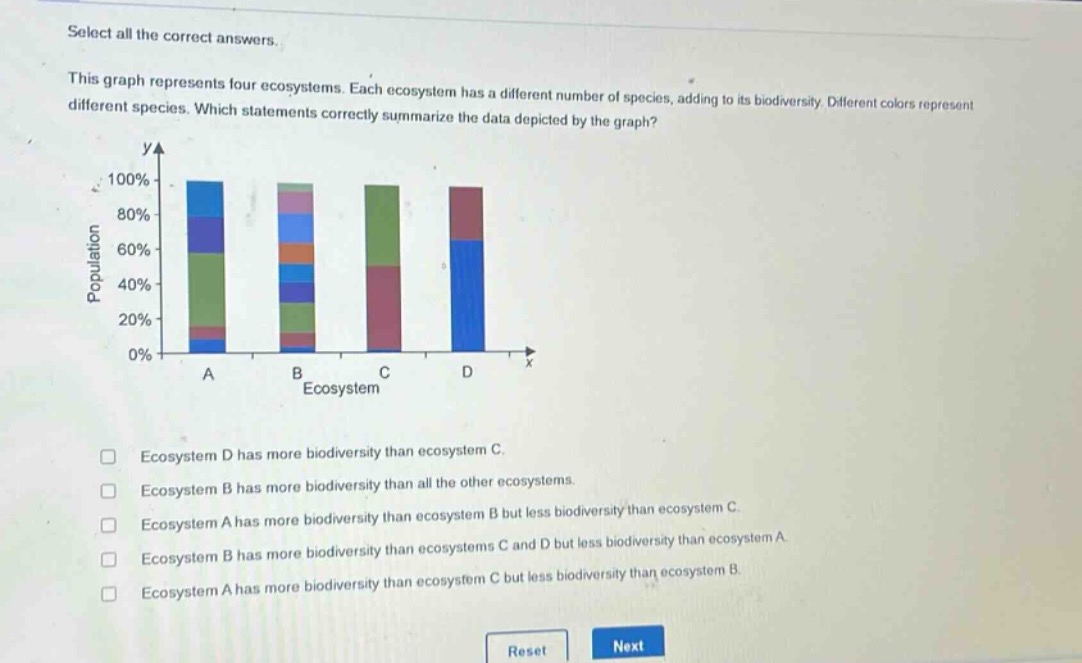
select all the correct answers. this graph represents four ecosystems. each ecosystem has a different number of species, adding to its biodiversity. different colors represent different species. which statements correctly summarize the data depicted by the graph? ecosystem d has more biodiversity than ecosystem c. ecosystem b has more biodiversity than all the other ecosystems. ecosystem a has more biodiversity than ecosystem b but less biodiversity than ecosystem c. ecosystem b has more biodiversity than ecosystems c and d but less biodiversity than ecosystem a. ecosystem a has more biodiversity than ecosystem c but less biodiversity than ecosystem b.
Answer
Answer:
- Ecosystem B has more biodiversity than all the other ecosystems.
- Ecosystem A has more biodiversity than ecosystem C but less biodiversity than ecosystem B.
Explanation:
Step1: Observe species - variety
Biodiversity is related to the number of species. More colors mean more species.
Step2: Analyze ecosystem B
Ecosystem B has the most different - colored segments, so it has the highest biodiversity.
Step3: Compare A, C and B
Ecosystem A has more colors than C, but fewer than B. So A has more biodiversity than C but less than B.