select the correct graph. identify the graph that represents the growth of a population that has reached the…
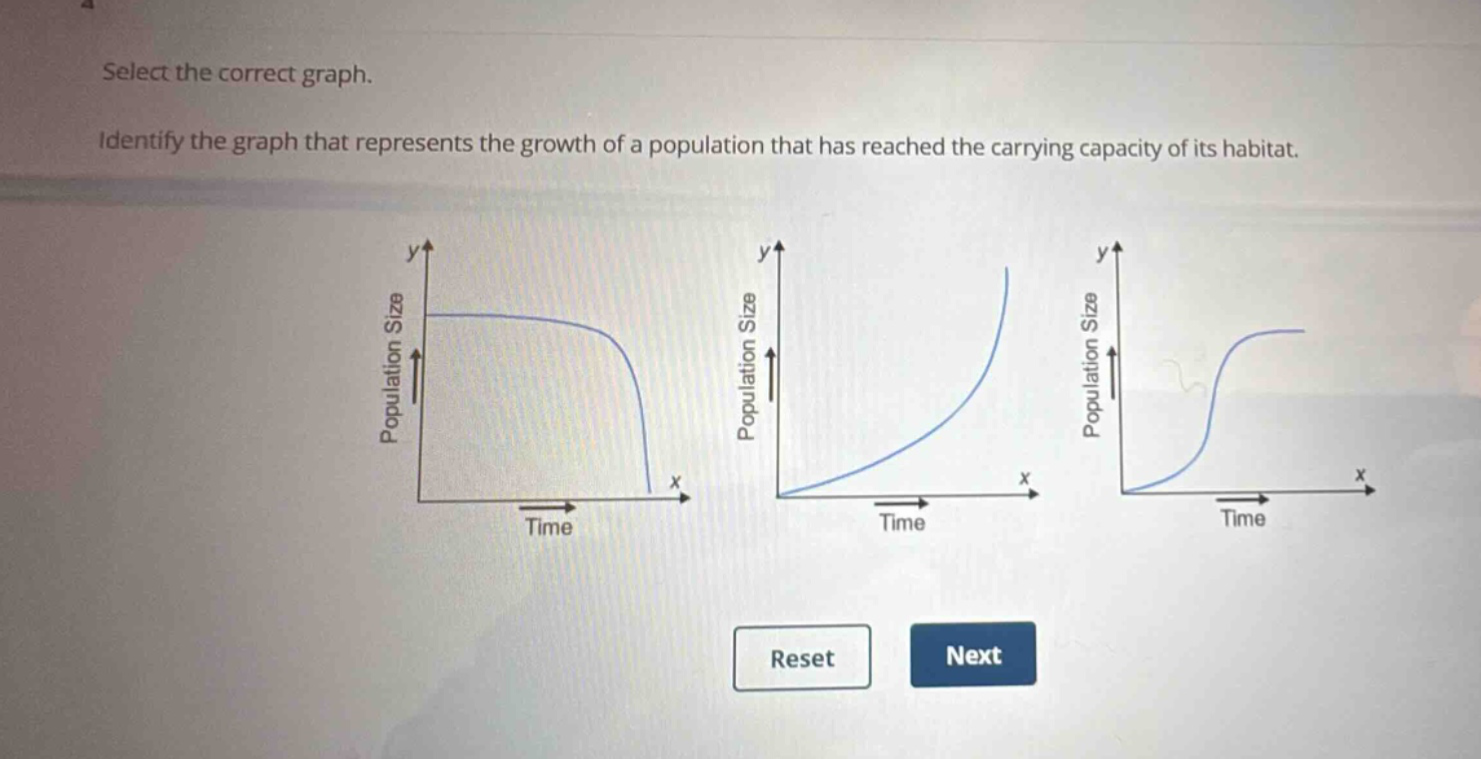
select the correct graph. identify the graph that represents the growth of a population that has reached the carrying capacity of its habitat.
Answer
Answer:
The third graph (the one on the far - right)
Explanation:
Step1: Recall population growth concept
When a population reaches its carrying capacity, growth levels off.
Step2: Analyze first graph
It shows a declining population, not a population at carrying capacity.
Step3: Analyze second graph
It shows exponential growth, not a population at carrying capacity.
Step4: Analyze third graph
The population size increases and then levels off, representing a population that has reached its carrying capacity.