select the correct location on the image. identify the position on the graph that gives the carrying…
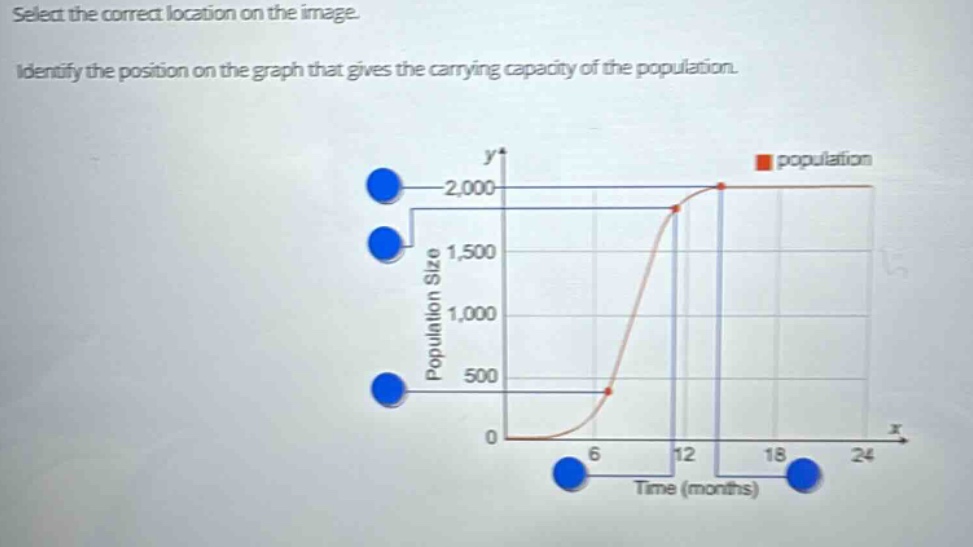
select the correct location on the image. identify the position on the graph that gives the carrying capacity of the population.
Answer
Answer:
The point on the graph where the population size levels - off at 2000 (the upper - horizontal part of the curve at y = 2000).
Explanation:
Step1: Understand carrying capacity
Carrying capacity is the maximum population size an environment can sustain.
Step2: Analyze the graph
The population curve flattens at y = 2000, indicating the environment's limit.