select the correct number on the image. this map shows the amount of soil moisture (sm), which is an…
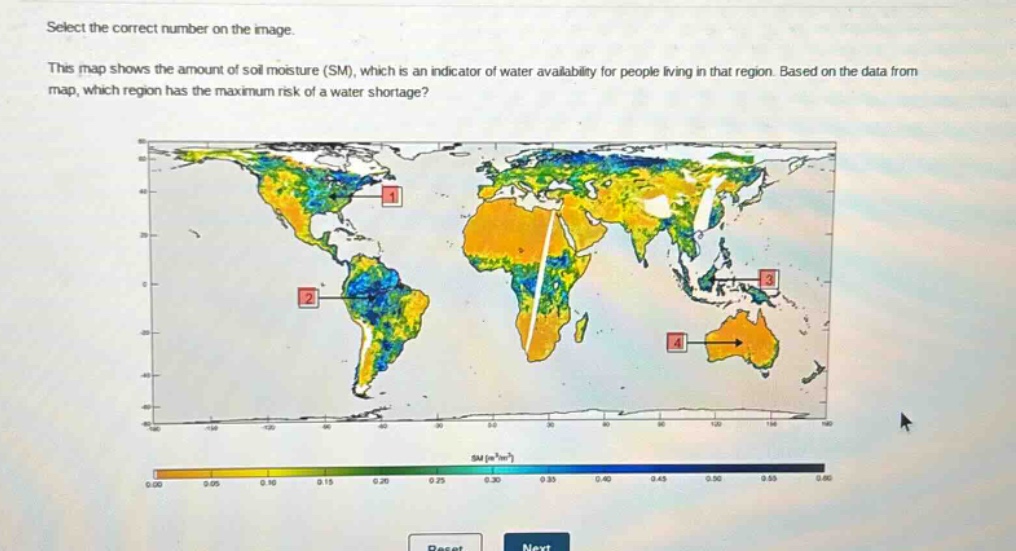
select the correct number on the image. this map shows the amount of soil moisture (sm), which is an indicator of water availability for people living in that region. based on the data from map, which region has the maximum risk of a water shortage?
Answer
Explanation:
Step1: Understand soil - moisture as water - availability indicator
Lower soil - moisture means higher water - shortage risk.
Step2: Observe the map colors
Areas with lower soil - moisture values (closer to 0 on the color - scale) have higher water - shortage risk.
Step3: Identify the region
Region 4 (Australia) appears to have a large area with low soil - moisture values compared to the other regions marked.
Answer:
4