step 5: use the data to model the sizes of the flocks in the second generation\n| | flock x | flock y |…
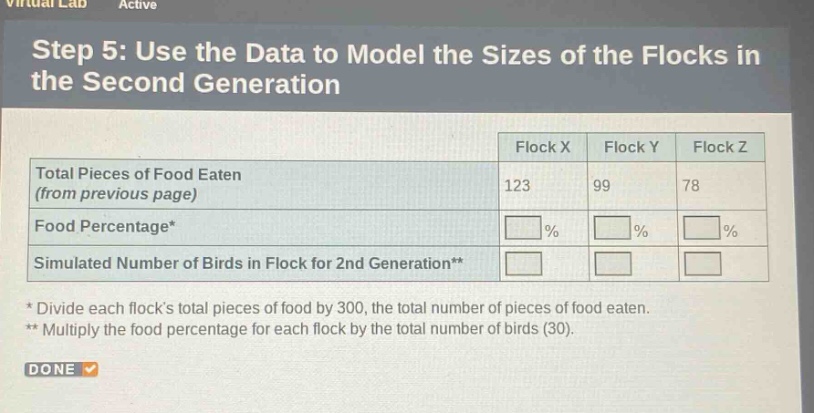
step 5: use the data to model the sizes of the flocks in the second generation\n| | flock x | flock y | flock z |\n|--|--|--|--|\n| total pieces of food eaten (from previous page) | 123 | 99 | 78 |\n| food percentage* | | | |\n| simulated number of birds in flock for 2nd generation** | | | |\n* divide each flocks total pieces of food by 300, the total number of pieces of food eaten.\n** multiply the food percentage for each flock by the total number of birds (30).\ndone
Answer
Explanation:
Step1: Calculate food percentage for Flock X
$Food\ percentage\ of\ Flock\ X=\frac{123}{300}\times100 = 41%$
Step2: Calculate food percentage for Flock Y
$Food\ percentage\ of\ Flock\ Y=\frac{99}{300}\times100 = 33%$
Step3: Calculate food percentage for Flock Z
$Food\ percentage\ of\ Flock\ Z=\frac{78}{300}\times100 = 26%$
Step4: Calculate simulated number of birds for Flock X in 2nd generation
$Simulated\ number\ of\ birds\ in\ Flock\ X = 0.41\times30=12.3\approx12$
Step5: Calculate simulated number of birds for Flock Y in 2nd generation
$Simulated\ number\ of\ birds\ in\ Flock\ Y = 0.33\times30 = 9.9\approx10$
Step6: Calculate simulated number of birds for Flock Z in 2nd generation
$Simulated\ number\ of\ birds\ in\ Flock\ Z = 0.26\times30=7.8\approx8$
Answer:
| Flock X | Flock Y | Flock Z | |
|---|---|---|---|
| Food Percentage | 41% | 33% | 26% |
| Simulated Number of Birds in Flock for 2nd Generation | 12 | 10 | 8 |