the table represents the recommended exercise intensity for an aerobic program based on the number of visits…
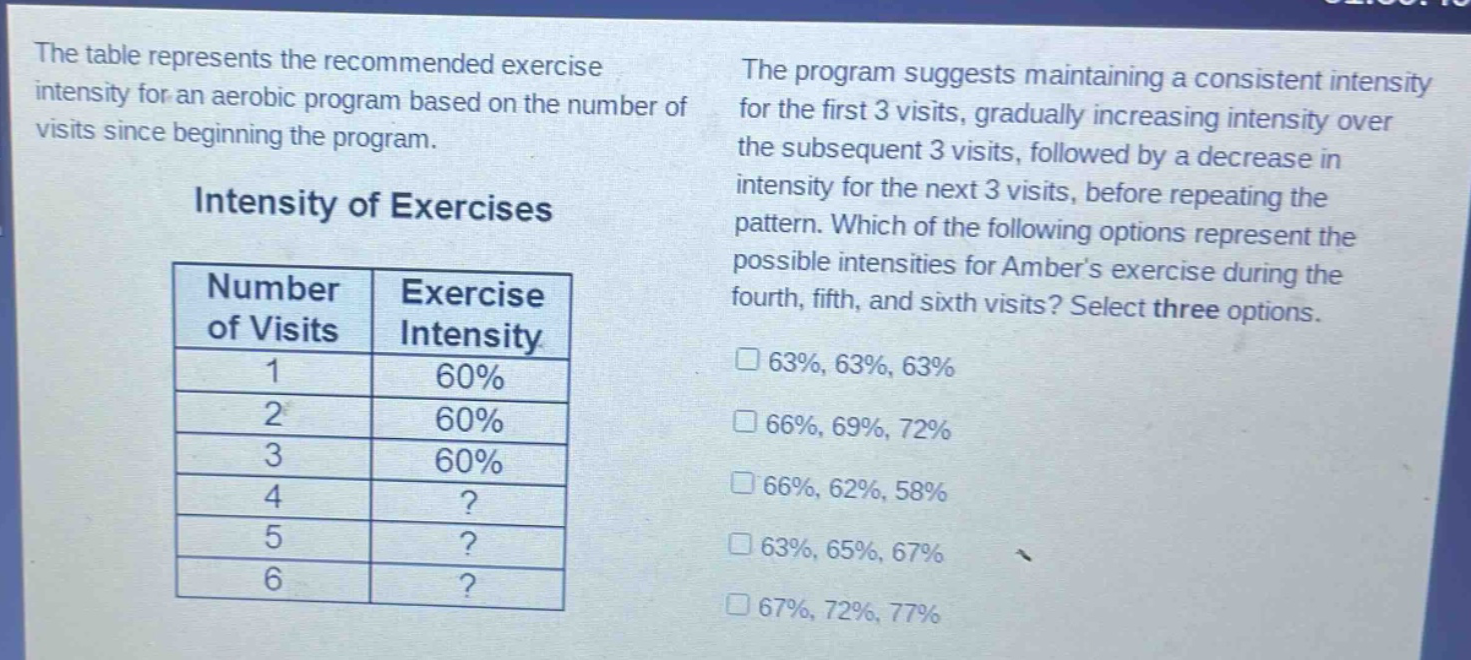
the table represents the recommended exercise intensity for an aerobic program based on the number of visits since beginning the program.\n\nintensity of exercises\n| number of visits | exercise intensity |\n| ---- | ---- |\n| 1 | 60% |\n| 2 | 60% |\n| 3 | 60% |\n| 4 |? |\n| 5 |? |\n| 6 |? |\n\nthe program suggests maintaining a consistent intensity for the first 3 visits, gradually increasing intensity over the subsequent 3 visits, followed by a decrease in intensity for the next 3 visits, before repeating the pattern. which of the following options represent the possible intensities for ambers exercise during the fourth, fifth, and sixth visits? select three options.\n□ 63%, 63%, 63%\n□ 66%, 69%, 72%\n□ 66%, 62%, 58%\n□ 63%, 65%, 67%\n□ 67%, 72%, 77%
Answer
Explanation:
Step1: Identify the pattern
The program has a pattern where intensity is consistent for first 3 visits, then increases for next 3 visits, then decreases for next 3 visits. For visits 4 - 6, intensity should be increasing.
Step2: Analyze options
We need to find options where the values are increasing.
- Option 1: 63%, 63%, 63% - No increase.
- Option 2: 66%, 69%, 72% - Increasing.
- Option 3: 66%, 62%, 58% - Decreasing.
- Option 4: 63%, 65%, 67% - Increasing.
- Option 5: 67%, 72%, 77% - Increasing.
Answer:
B. 66%, 69%, 72% D. 63%, 65%, 67% E. 67%, 72%, 77%