year\tsaturated thickness (feet)\n1975\t107.5\n1980\t95.5\n1985\t84.25\n1990\t73.75\n1995\t63.75\n2000\t55.25…
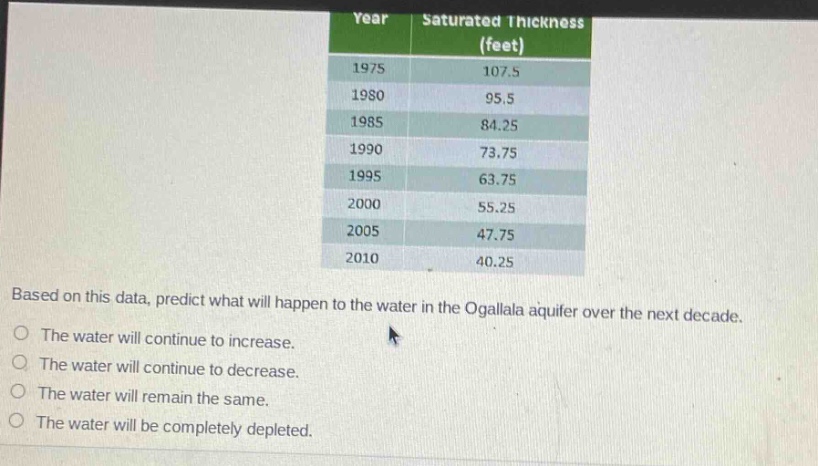
year\tsaturated thickness (feet)\n1975\t107.5\n1980\t95.5\n1985\t84.25\n1990\t73.75\n1995\t63.75\n2000\t55.25\n2005\t47.75\n2010\t40.25\nbased on this data, predict what will happen to the water in the ogallala aquifer over the next decade.\nthe water will continue to increase.\nthe water will continue to decrease.\nthe water will remain the same.\nthe water will be completely depleted.
Answer
Answer:
The water will continue to decrease.
Explanation:
Step1: Observe data trend
From 1975 - 2010, saturated thickness decreases each year. 1975: 107.5 feet, 2010: 40.25 feet.
Step2: Make prediction
Since the trend is decreasing, it will likely continue in the next decade.