35 a software company kept a record of their annual budget for advertising and their profit for each of the…
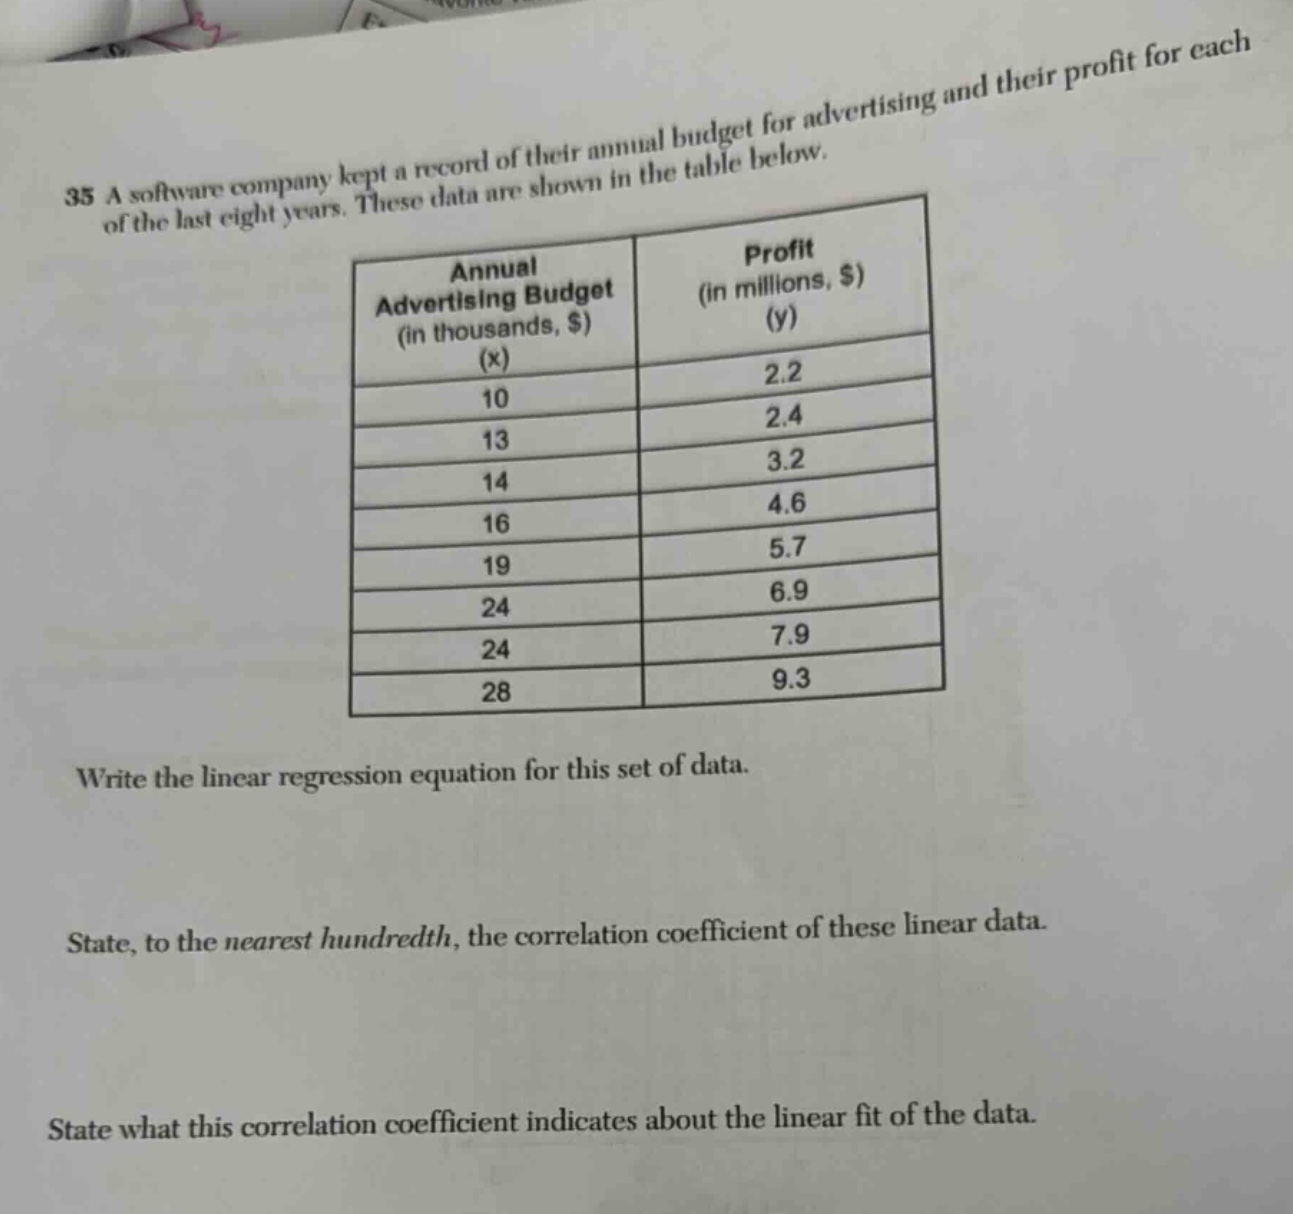
35 a software company kept a record of their annual budget for advertising and their profit for each of the last eight years. these data are shown in the table below.\n\n| annual advertising budget (in thousands, $) (x) | profit (in millions, $) (y) |\n| ---- | ---- |\n| 10 | 2.2 |\n| 13 | 2.4 |\n| 14 | 3.2 |\n| 16 | 4.6 |\n| 19 | 5.7 |\n| 24 | 6.9 |\n| 24 | 7.9 |\n| 28 | 9.3 |\n\nwrite the linear regression equation for this set of data.\n\nstate, to the nearest hundredth, the correlation coefficient of these linear data.\n\nstate what this correlation coefficient indicates about the linear fit of the data.
Answer
Explanation:
Step1: Calculate means of x and y
Let (x_i) be the advertising - budget values and (y_i) be the profit values. (n = 8). (\bar{x}=\frac{10 + 13+14+16+19+24+24+28}{8}=\frac{148}{8}=18.5) (\bar{y}=\frac{2.2 + 2.4+3.2+4.6+5.7+6.9+7.9+9.3}{8}=\frac{42.2}{8}=5.275)
Step2: Calculate the slope (b)
The formula for the slope (b) of the regression line is (b=\frac{\sum_{i = 1}^{n}(x_i-\bar{x})(y_i - \bar{y})}{\sum_{i = 1}^{n}(x_i-\bar{x})^2}) (\sum_{i = 1}^{n}(x_i-\bar{x})(y_i - \bar{y})=(10 - 18.5)(2.2-5.275)+(13 - 18.5)(2.4 - 5.275)+(14 - 18.5)(3.2 - 5.275)+(16 - 18.5)(4.6 - 5.275)+(19 - 18.5)(5.7 - 5.275)+(24 - 18.5)(6.9 - 5.275)+(24 - 18.5)(7.9 - 5.275)+(28 - 18.5)(9.3 - 5.275)) (=(- 8.5)(-3.075)+(-5.5)(-2.875)+(-4.5)(-2.075)+(-2.5)(-0.675)+(0.5)(0.425)+(5.5)(1.625)+(5.5)(2.625)+(9.5)(4.025)) (=26.1375 + 15.8125+9.3375 + 1.6875+0.2125+8.9375+14.4375+38.2375) (=114.8) (\sum_{i = 1}^{n}(x_i-\bar{x})^2=(10 - 18.5)^2+(13 - 18.5)^2+(14 - 18.5)^2+(16 - 18.5)^2+(19 - 18.5)^2+(24 - 18.5)^2+(24 - 18.5)^2+(28 - 18.5)^2) (=(-8.5)^2+(-5.5)^2+(-4.5)^2+(-2.5)^2+(0.5)^2+(5.5)^2+(5.5)^2+(9.5)^2) (=72.25+30.25 + 20.25+6.25+0.25+30.25+30.25+90.25) (=280) (b=\frac{114.8}{280}=0.41)
Step3: Calculate the y - intercept (a)
The formula for the y - intercept (a) is (a=\bar{y}-b\bar{x}) (a = 5.275-0.41\times18.5) (a = 5.275 - 7.585=-2.31) The linear regression equation is (y = 0.41x-2.31)
Step4: Calculate the correlation coefficient (r)
The formula for the correlation coefficient (r) is (r=\frac{\sum_{i = 1}^{n}(x_i-\bar{x})(y_i - \bar{y})}{\sqrt{\sum_{i = 1}^{n}(x_i-\bar{x})^2\sum_{i = 1}^{n}(y_i - \bar{y})^2}}) First, calculate (\sum_{i = 1}^{n}(y_i - \bar{y})^2=(2.2 - 5.275)^2+(2.4 - 5.275)^2+(3.2 - 5.275)^2+(4.6 - 5.275)^2+(5.7 - 5.275)^2+(6.9 - 5.275)^2+(7.9 - 5.275)^2+(9.3 - 5.275)^2) (=(-3.075)^2+(-2.875)^2+(-2.075)^2+(-0.675)^2+(0.425)^2+(1.625)^2+(2.625)^2+(4.025)^2) (=9.455625+8.265625+4.305625+0.455625+0.180625+2.640625+6.890625+16.200625) (=48.495) (r=\frac{114.8}{\sqrt{280\times48.495}}=\frac{114.8}{\sqrt{13578.6}}=\frac{114.8}{116.52}\approx0.99)
Step5: Interpret the correlation coefficient
A correlation coefficient (r\approx0.99) indicates a very strong positive linear relationship between the annual advertising budget and the profit. The closer (r) is to 1, the better the linear fit of the data.
Answer:
The linear regression equation is (y = 0.41x-2.31). The correlation coefficient is approximately (0.99). A correlation coefficient of approximately (0.99) indicates a very strong positive linear relationship between the annual advertising budget and the profit.