average salary ($)\n48,000\n46,000\n44,000\n42,000\n40,000\n1 2 3\nyear\nwhy is the graph misleading?\nthe…
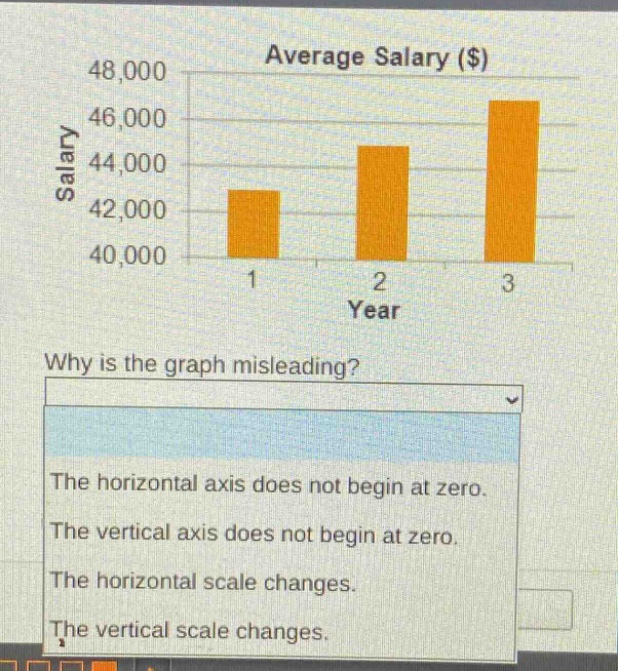
average salary ($)\n48,000\n46,000\n44,000\n42,000\n40,000\n1 2 3\nyear\nwhy is the graph misleading?\nthe horizontal axis does not begin at zero.\nthe vertical axis does not begin at zero.\nthe horizontal scale changes.\nthe vertical scale changes.
Answer
Brief Explanations:
The vertical - axis starting point is not zero. This can exaggerate the differences in average salaries between years. For example, if the vertical axis started at zero, the relative differences between the bars would appear less extreme.
Answer:
The vertical axis does not begin at zero.