what is the best way to improve the clarity of this data?\nnumber of units sold and revenue in the first…
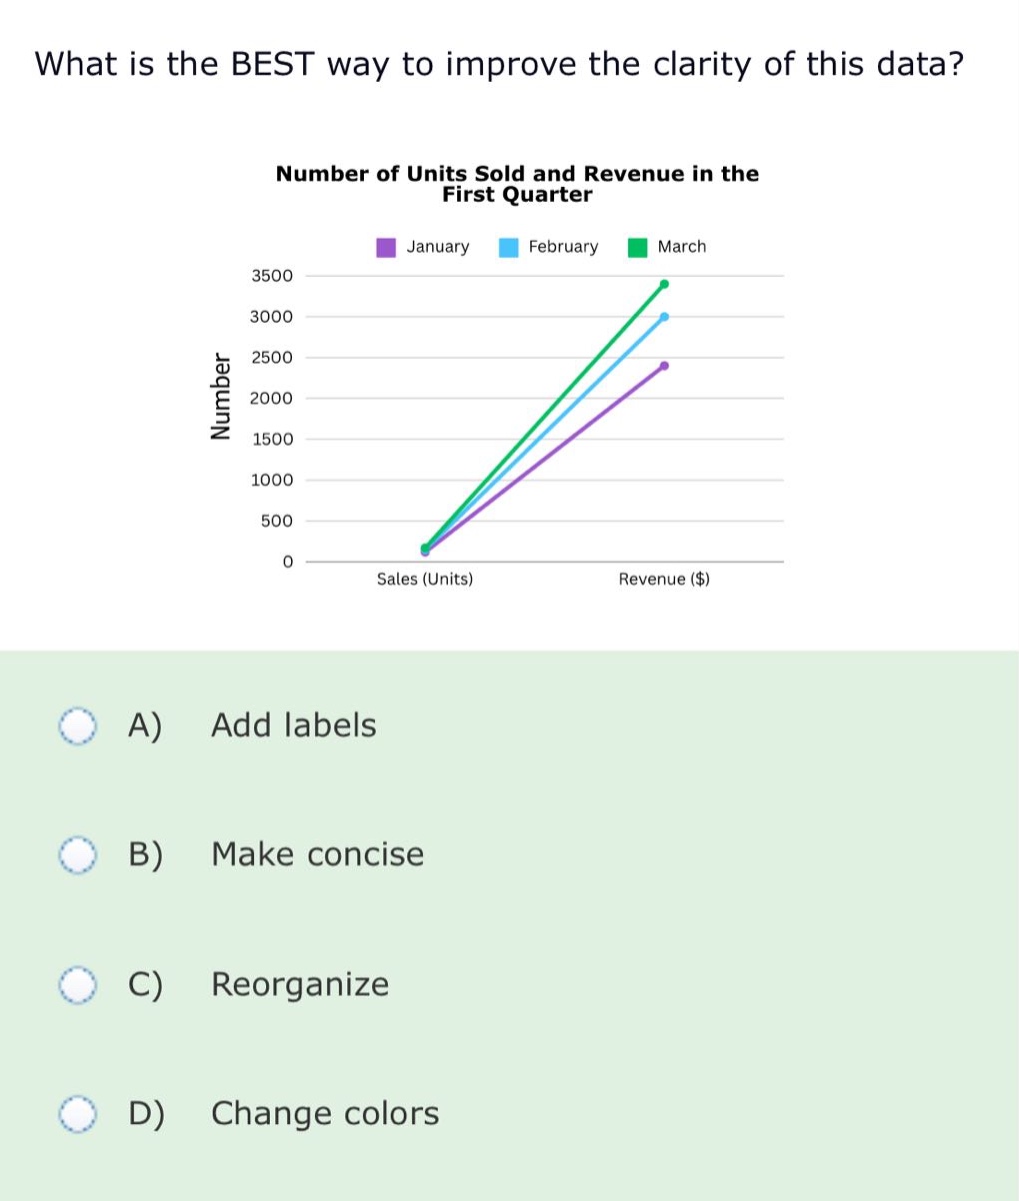
what is the best way to improve the clarity of this data?\nnumber of units sold and revenue in the first quarter\njanuary february march\n3500\n3000\n2500\n2000\n1500\n1000\n500\n0\nsales (units) revenue ($)\na) add labels\nb) make concise\nc) reorganize\nd) change colors
Answer
Brief Explanations:
Adding labels to a graph makes it clear what each data - point or line represents. In this graph, while the general trends are visible, specific values and more detailed information about the data for each month and category (sales vs revenue) can be better understood with labels. Making it concise doesn't directly address clarity here as the graph is already relatively simple. Reorganizing isn't necessary as the current layout is logical. Changing colors won't improve the understanding of the data values and categories as much as adding labels will.
Answer:
A. Add labels