what is the best way to improve the clarity of this data? number of units sold and revenue in the first…
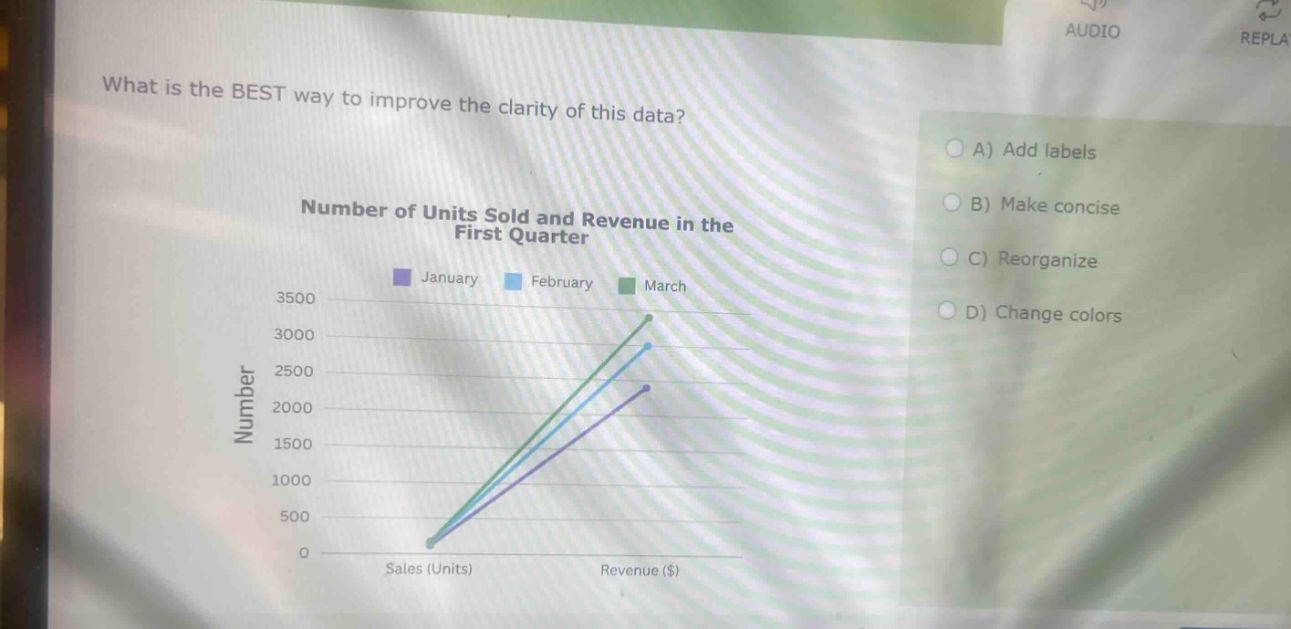
what is the best way to improve the clarity of this data? number of units sold and revenue in the first quarter january february march 3500 3000 2500 2000 1500 1000 500 0 sales (units) revenue ($) a) add labels b) make concise c) reorganize d) change colors
Answer
Brief Explanations:
Adding labels to data visualizations clearly defines what each element represents, enhancing understanding. In this graph, labels would make it clear which lines correspond to which months for both sales and revenue, improving clarity. Making it concise, reorganizing, or changing colors won't directly address the lack of clear identification of data - points as effectively as adding labels.
Answer:
A. Add labels