what is the best way to improve the clarity of this data?\nnumber of units sold and revenue\nsales (units)…
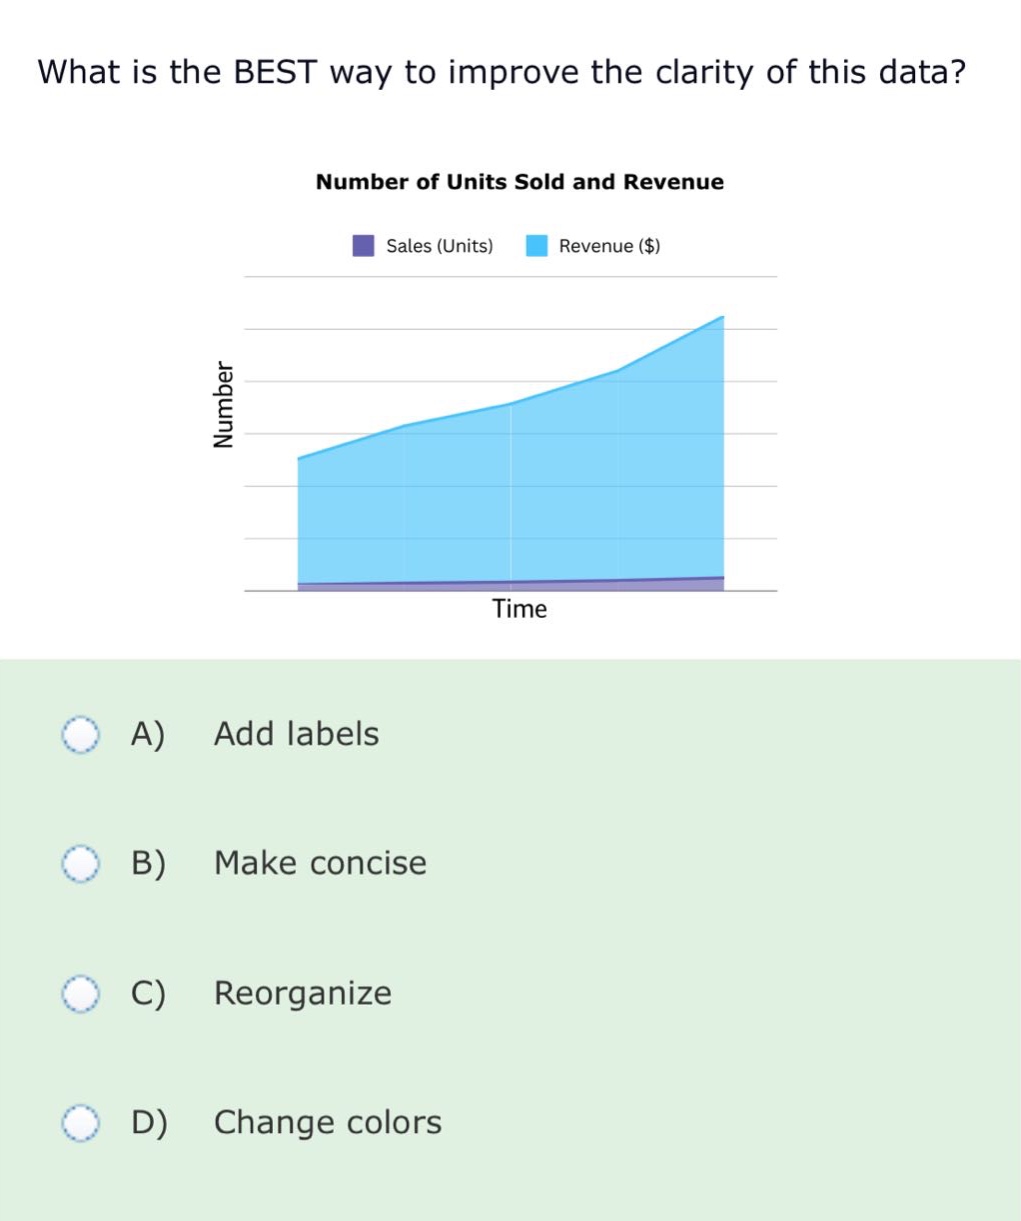
what is the best way to improve the clarity of this data?\nnumber of units sold and revenue\nsales (units) revenue ($)\nnumber\ntime\na) add labels\nb) make concise\nc) reorganize\nd) change colors
Answer
Brief Explanations:
The graph has an unclear y - axis as it just says "Number" without specifying what kind of number (e.g., units or dollars). Adding more specific labels would make the data clearer.
Answer:
A. Add labels