a company makes valves. based on a random sample, the company concludes that 7% ± 1.9% of the valves have…
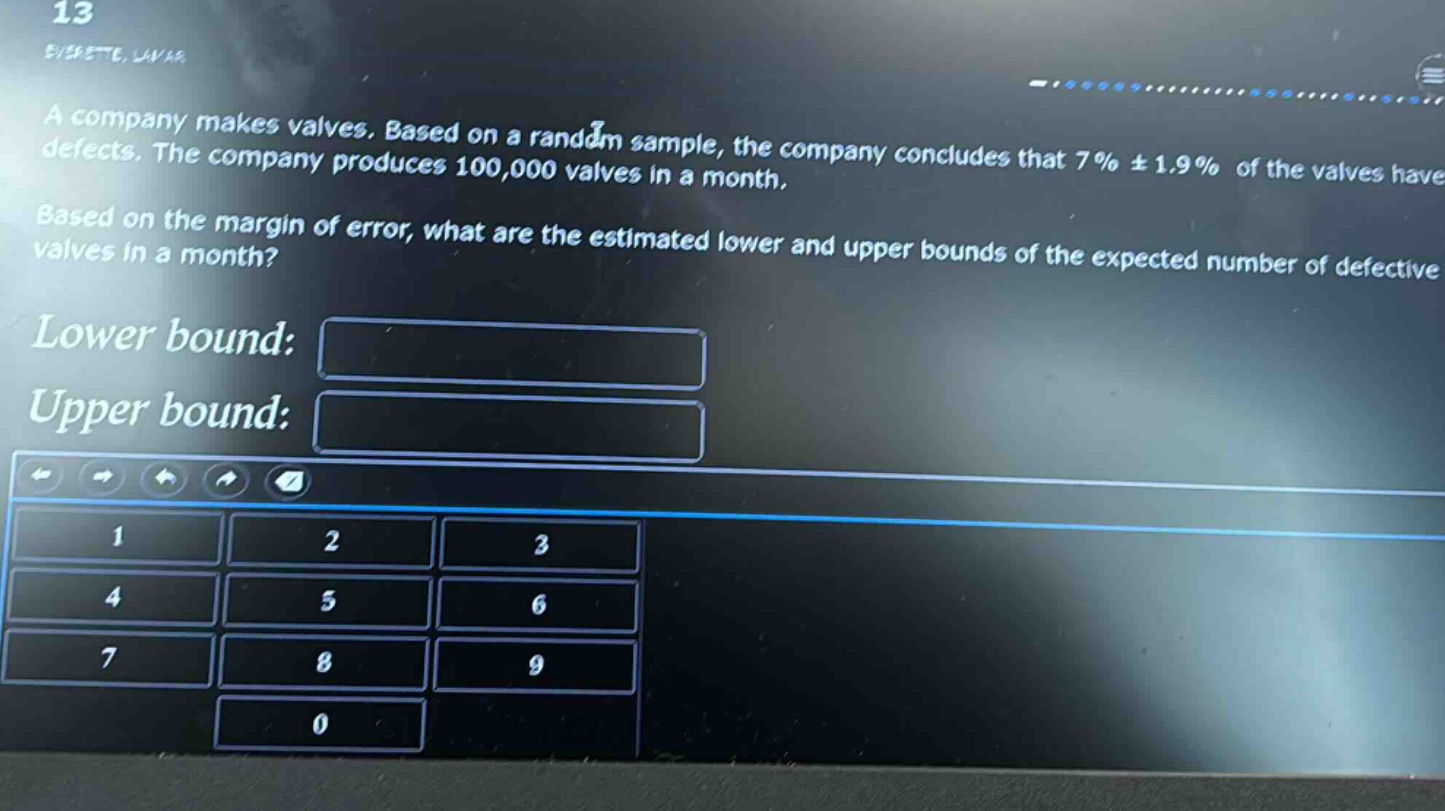
a company makes valves. based on a random sample, the company concludes that 7% ± 1.9% of the valves have defects. the company produces 100,000 valves in a month. based on the margin of error, what are the estimated lower and upper bounds of the expected number of defective valves in a month? lower bound: upper bound:
Answer
Explanation:
Step1: Calculate lower - bound percentage
The lower - bound percentage of defective valves is $7%-1.9% = 5.1%$.
Step2: Calculate lower - bound number of defective valves
Multiply the lower - bound percentage by the total number of valves. $100000\times0.051 = 5100$.
Step3: Calculate upper - bound percentage
The upper - bound percentage of defective valves is $7% + 1.9%=8.9%$.
Step4: Calculate upper - bound number of defective valves
Multiply the upper - bound percentage by the total number of valves. $100000\times0.089 = 8900$.
Answer:
Lower bound: 5100 Upper bound: 8900