a computer company produced this graph to show how many computers it expects to sell based on how much the…
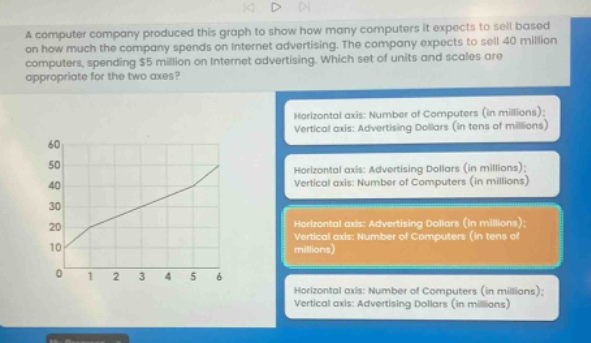
a computer company produced this graph to show how many computers it expects to sell based on how much the company spends on internet advertising. the company expects to sell 40 million computers, spending $5 million on internet advertising. which set of units and scales are appropriate for the two axes? horizontal axis: number of computers (in millions); vertical axis: advertising dollars (in tens of millions) horizontal axis: advertising dollars (in millions); vertical axis: number of computers (in millions) horizontal axis: advertising dollars (in millions); vertical axis: number of computers (in tens of millions) horizontal axis: number of computers (in millions); vertical axis: advertising dollars (in millions)
Answer
Explanation:
Step1: Identify the independent and dependent variables
The company is trying to show how the number of computers it expects to sell depends on the amount of money it spends on internet - advertising. So, the amount of advertising dollars is the independent variable and the number of computers sold is the dependent variable.
Step2: Determine the axes
The independent variable (advertising dollars) is usually placed on the horizontal axis and the dependent variable (number of computers) is placed on the vertical axis. The company expects to sell up to 40 million computers and spends up to 5 million on advertising. So, the horizontal axis should be advertising dollars (in millions) and the vertical axis should be the number of computers (in millions).
Answer:
Horizontal axis: Advertising Dollars (in millions); Vertical axis: Number of Computers (in millions)