dana would like to see how the sales of apples have compared to the sales of pears this season. what graph…
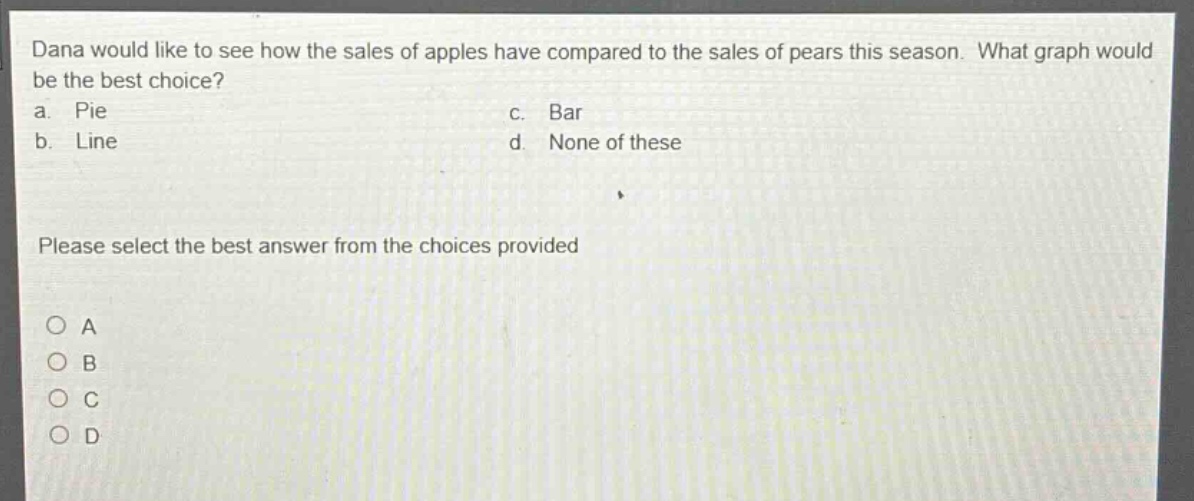
dana would like to see how the sales of apples have compared to the sales of pears this season. what graph would be the best choice? a. pie b. line c. bar d. none of these please select the best answer from the choices provided a b c d
Answer
Brief Explanations:
Pie charts show proportions of a whole, line charts are for trends over time. Bar charts are ideal for comparing discrete quantities like apple and pear sales.
Answer:
C. Bar