the following chart shows a stores records of sales of stuffed toys for two months. september october teddy…
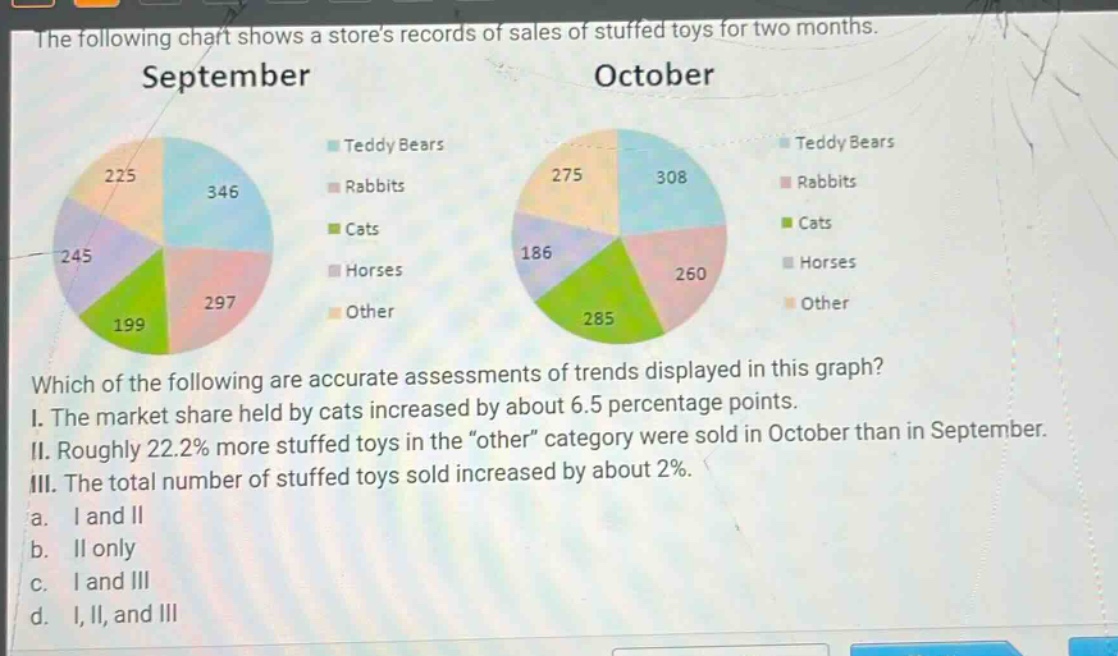
the following chart shows a stores records of sales of stuffed toys for two months. september october teddy bears teddy bears rabbits rabbits cats cats horses horses other other which of the following are accurate assessments of trends displayed in this graph? i. the market share held by cats increased by about 6.5 percentage points. ii. roughly 22.2% more stuffed toys in the \other\ category were sold in october than in september. iii. the total number of stuffed toys sold increased by about 2%. a. i and ii b. ii only c. i and iii d. i, ii, and iii
Answer
Explanation:
Step1: Calculate total sales in September
$346 + 297+199 + 245+225=1312$
Step2: Calculate percentage of cats in September
$\frac{199}{1312}\times100%\approx15.17%$
Step3: Calculate total sales in October
$308 + 260+285 + 186+275 = 1314$
Step4: Calculate percentage of cats in October
$\frac{285}{1314}\times100%\approx21.7%$
Step5: Calculate increase in cat - market - share
$21.7%-15.17% = 6.53%\approx6.5%$, so statement I is correct.
Step6: Calculate number of 'other' toys in September and October
In September, number of 'other' toys is 225. In October, it is 275.
Step7: Calculate percentage increase in 'other' toys
$\frac{275 - 225}{225}\times100%=\frac{50}{225}\times100%\approx22.2%$, so statement II is correct.
Step8: Calculate percentage increase in total sales
$\frac{1314 - 1312}{1312}\times100%=\frac{2}{1312}\times100%\approx0.15%$, so statement III is incorrect.
Answer:
a. I and II