the following table represents the monthly sales of a company over the course of a year.\n| month | sales…
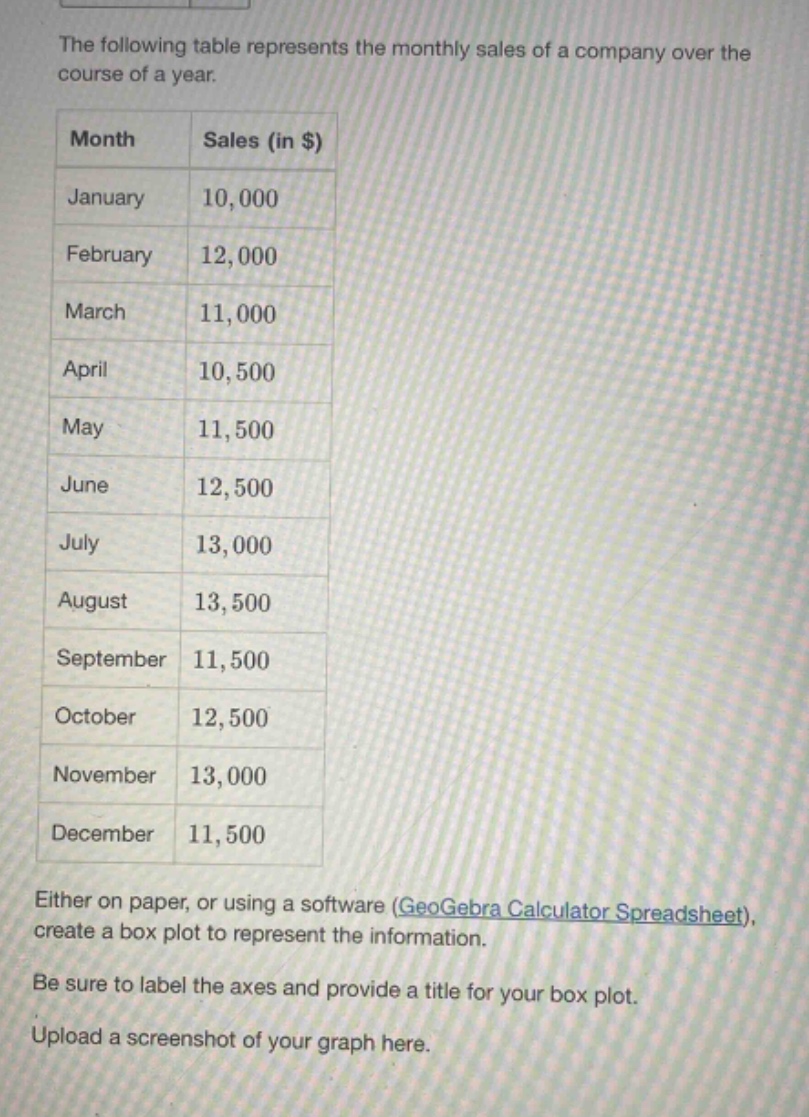
the following table represents the monthly sales of a company over the course of a year.\n| month | sales (in $) |\n| january | 10,000 |\n| february | 12,000 |\n| march | 11,000 |\n| april | 10,500 |\n| may | 11,500 |\n| june | 12,500 |\n| july | 13,000 |\n| august | 13,500 |\n| september | 11,500 |\n| october | 12,500 |\n| november | 13,000 |\n| december | 11,500 |\neither on paper, or using a software (geogebra calculator spreadsheet), create a box plot to represent the information.\nbe sure to label the axes and provide a title for your box plot.\nupload a screenshot of your graph here.
Answer
Explanation:
Step1: Arrange data in ascending order
$10000, 10500, 11000, 11500, 11500, 11500, 12000, 12500, 12500, 13000, 13000, 13500$
Step2: Find the median (Q2)
There are $n = 12$ data - points. The median is the average of the 6th and 7th ordered values. $\text{Q2}=\frac{11500 + 12000}{2}=11750$
Step3: Find the lower half of data
The lower - half is $10000, 10500, 11000, 11500, 11500, 11500$. The median of the lower - half (Q1) is the average of the 3rd and 4th ordered values. $\text{Q1}=\frac{11000+11500}{2}=11250$
Step4: Find the upper half of data
The upper - half is $12000, 12500, 12500, 13000, 13000, 13500$. The median of the upper - half (Q3) is the average of the 3rd and 4th ordered values. $\text{Q3}=\frac{12500 + 13000}{2}=12750$
Step5: Find the minimum and maximum values
The minimum value is $10000$ and the maximum value is $13500$
Step6: Draw the box - plot
On the x - axis, label it "Sales (in $)" and on the y - axis, you can have a scale appropriate for the range of values. The title of the box - plot can be "Monthly Sales of the Company". Draw a box from Q1 to Q3 with a line at Q2 inside the box. Draw whiskers from the box to the minimum and maximum values.
Since I can't upload a screenshot, the steps above are for creating the box - plot.
Answer:
Follow the above steps to create a box - plot with title "Monthly Sales of the Company", x - axis labeled "Sales (in $)", and appropriate y - axis scale, with a box from $11250$ to $12750$, a line at $11750$ inside the box, and whiskers to $10000$ and $13500$.