the graph shows sales by year for a product. use the trend line to predict the total sales for this product…
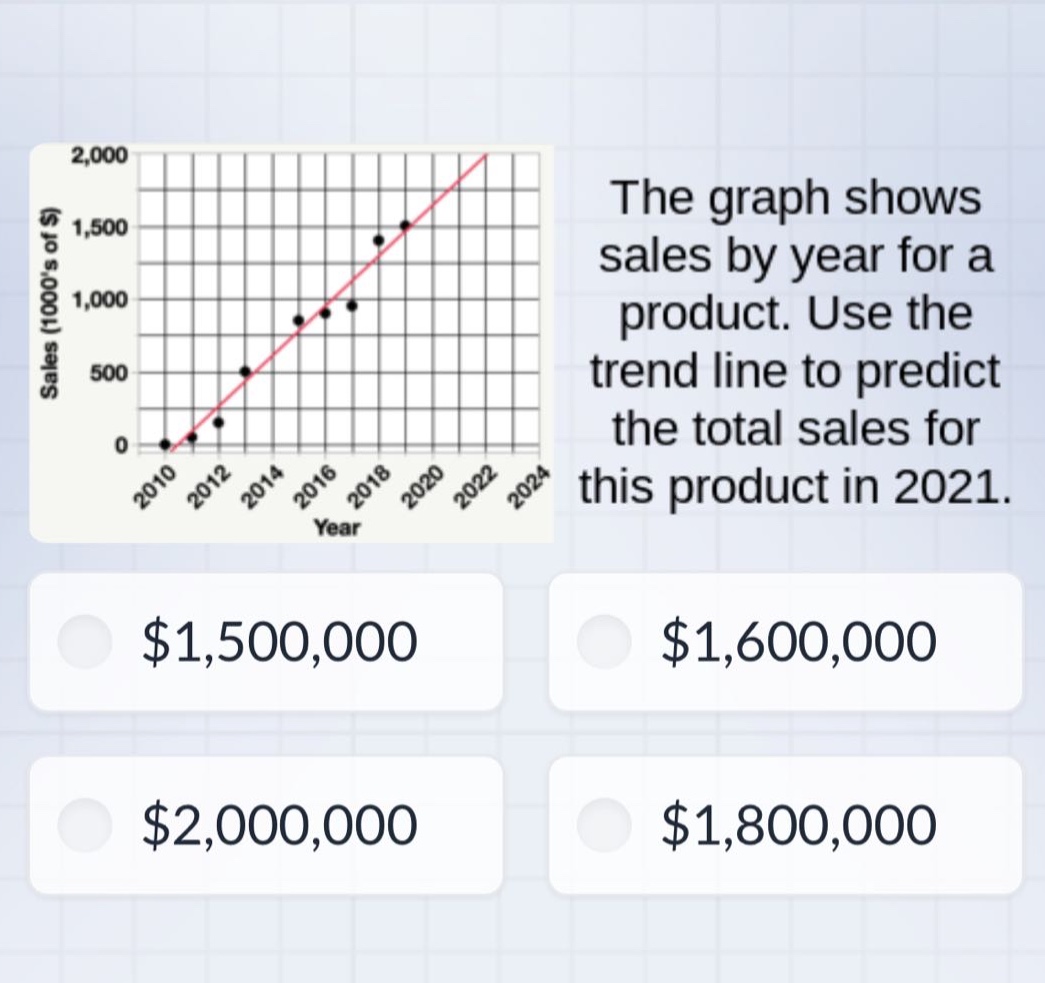
the graph shows sales by year for a product. use the trend line to predict the total sales for this product in 2021. $1,500,000 $1,600,000 $2,000,000 $1,800,000
Answer
Explanation:
Step1: Identify the x - value for 2021
Let 2010 be (x = 0), then for 2021, (x=2021 - 2010=11).
Step2: Estimate from the trend - line
Looking at the trend - line on the graph, when (x = 11), the sales (in thousands of dollars) are approximately 1600 (since the y - axis is in thousands of dollars).
Step3: Calculate the total sales
The total sales (S=1600\times1000 = 1600000) dollars.
Answer:
$1,600,000