the graph shows sales by year for a product. use the trend line to predict the total sales for this product…
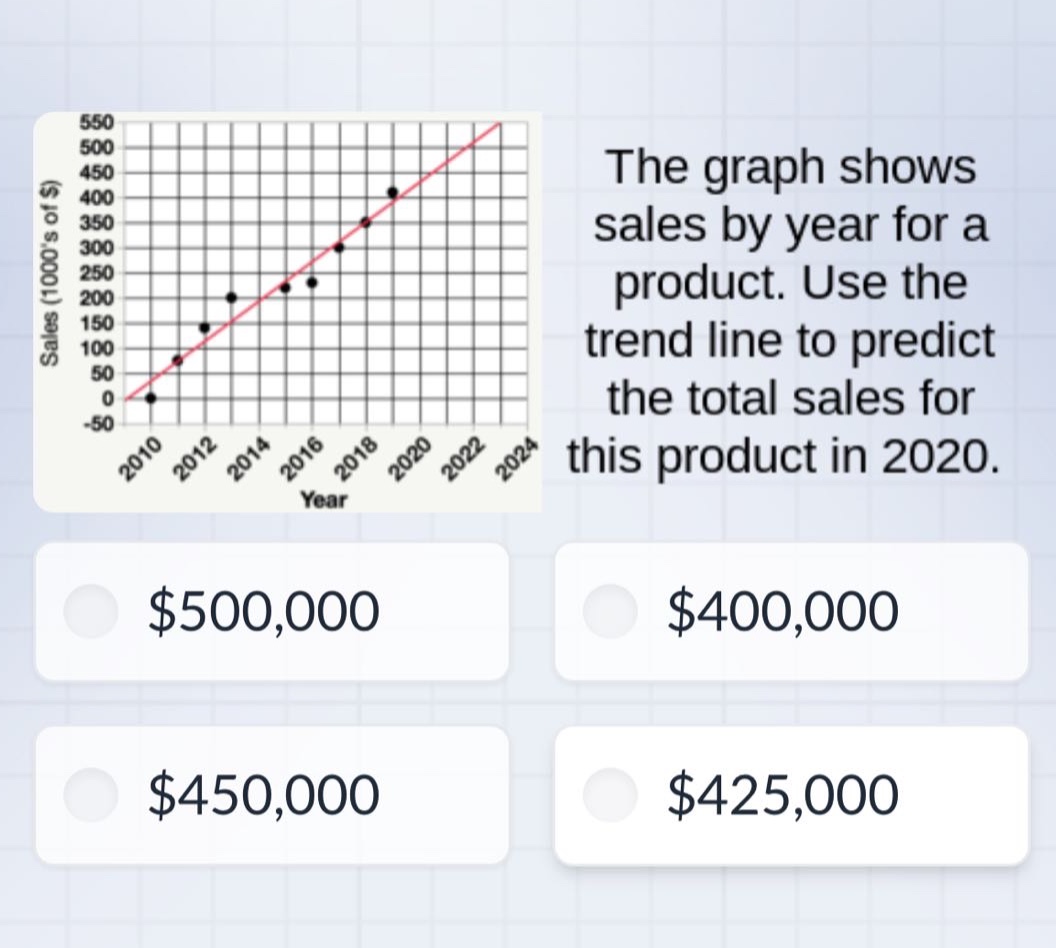
the graph shows sales by year for a product. use the trend line to predict the total sales for this product in 2020. $500,000 $400,000 $450,000 $425,000
Answer
Explanation:
Step1: Locate 2020 on x - axis
Find the year 2020 on the horizontal axis of the graph.
Step2: Read corresponding y - value
Go vertically up from 2020 to the trend line, then horizontally to the left to read the y - value on the vertical axis. The y - value is around 450 (in thousands of dollars).
Answer:
$450,000