the graph shows the yearly revenue of five companies and the amount of money each company spent on…
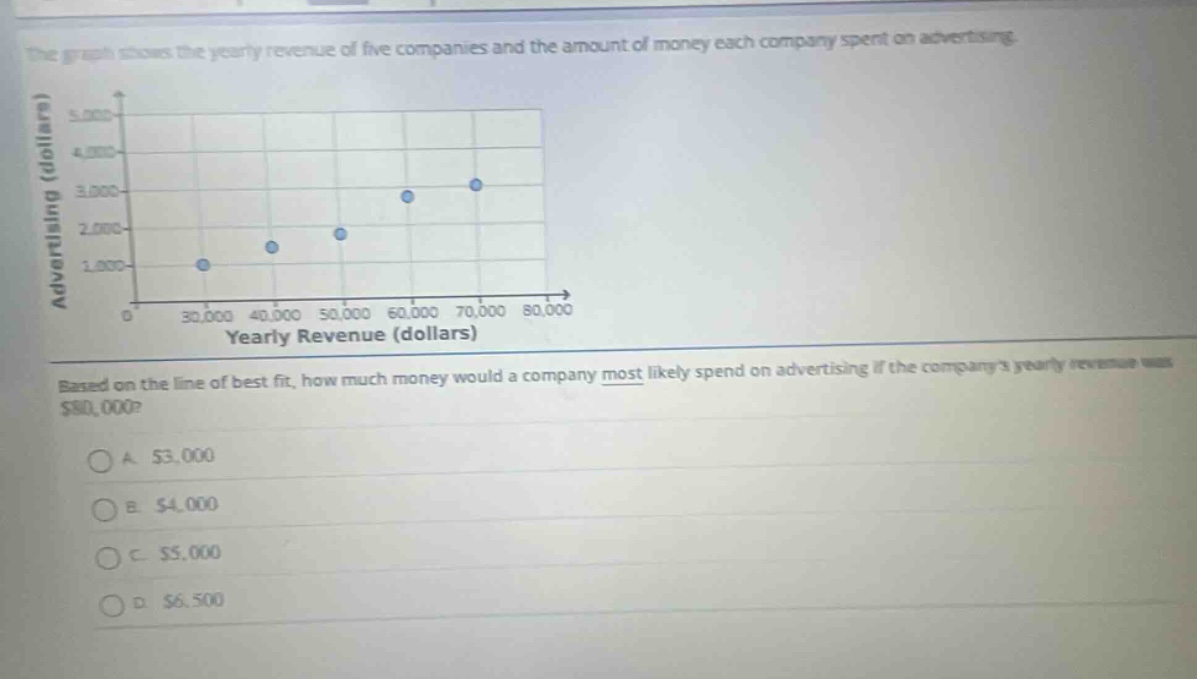
the graph shows the yearly revenue of five companies and the amount of money each company spent on advertising. based on the line of best fit, how much money would a company most likely spend on advertising if the companys yearly revenue was $80,000?\na. $3,000\nb. $4,000\nc. $5,000\nd. $6,500
Answer
Explanation:
Step1: Visualize line of best fit
Estimate position on graph for revenue of $80,000.
Step2: Read advertising - spend value
From the estimated line of best fit, when revenue is $80,000, advertising spend is around $4,000.
Answer:
B. $4,000